gis
Background
Understanding coordinate data, coordinate systems, and projections is fundamental to working effectively in GIS and performing spatial analyses . However, ArcGIS and WebGIS make it so easy to view and overlay data that it is easy to get pretty far in GIS without actually really understanding what you are doing. ArcGIS is clever in that as long as the data you add into a data frame in an ArcMap document has a correct projection associated with it will reproject and/or transform data on the fly to display and overlay correctly without you even knowing. Whether you are new to GIS, or already have some background in it, you should ask yourself:
- Do I know the difference between a geographic and a projected coordinate system?
- Do I know the difference between Cartesian, polar and cylindrical coordinate systems?
- What is an assumed coordinate system?
- When is it necessary to transform my data from one coordinate system to another?
- What is the appropriate transformation method to use?
- When I download data, how do I know what coordinate system it is in?
- How do know if my data are in the right place?
Another fundamental part of doing GIS, is the ability to do geoprocessing and analyses. That is, once you download data, you want to do more then simply visualize it. ArcGIS has an enormous amount of in-built tools. There are also a plethora of freeware, open-source, and commercial tools you can install in ArcGIS to use. Some of these tools are ArcGIS scripts, tools and models that you can add into ArcGIS’s toolbox. Others are found in the forms of Add-Ins and others are Plug-Ins, which need to be installed using an installer outside of ArcGIS. These extra tools really help extend the range of what you can do with ArcGIS.
Lab Objectives
In this lab, we are fundamentally concerned with helping you better understand coordinate systems and transformations between them. We want you to be able to easily answer all of the questions posed above. Such knowledge can help you avoid costly mistakes in the future. To instill this understanding, we are going to have you work with coordinate data from a stream habitat survey and transform it from an assumed coordinate system into a real world coordinate system so you can overlay it with other existing baselayers in GIS. Secondarily, we are going to provide very specific guidelines for how you should produce figures to drill the 6 C’s into you.
Meets Course Learning Outcomes 1, 2 & 5.
Instructions & Lab Tasks
Overview:
You are going to be provided with some unprojected total station survey data from a stream habitat survey of the Bear Valley Creek Study Site. These surveys are performed to assess the status of salmonids and their habitat at tributaries throughout the Columbia River Basin as part of the Columbia Habitat Monitoring Program (CHaMP) and the Integrated Status & Effectiveness Monitoring Program (ISEMP) run by NOAA Fisheries and funded by the Bonneville Power Administration(BPA).
The data was collected using an assumed coordinate system on a cartesian grid. You will find it is very precise data with high relative accuracy, but its location in real world coordinates is not nailed down. Your goal is to apply a coordinate transformation of this data into projected real world coordinates (UTM Zone 12 N) so that the data can be overlaid with other geographically explicit data layers and datasets as illustrated in the map below (see task 3).
Bear Valley Creek Study Site
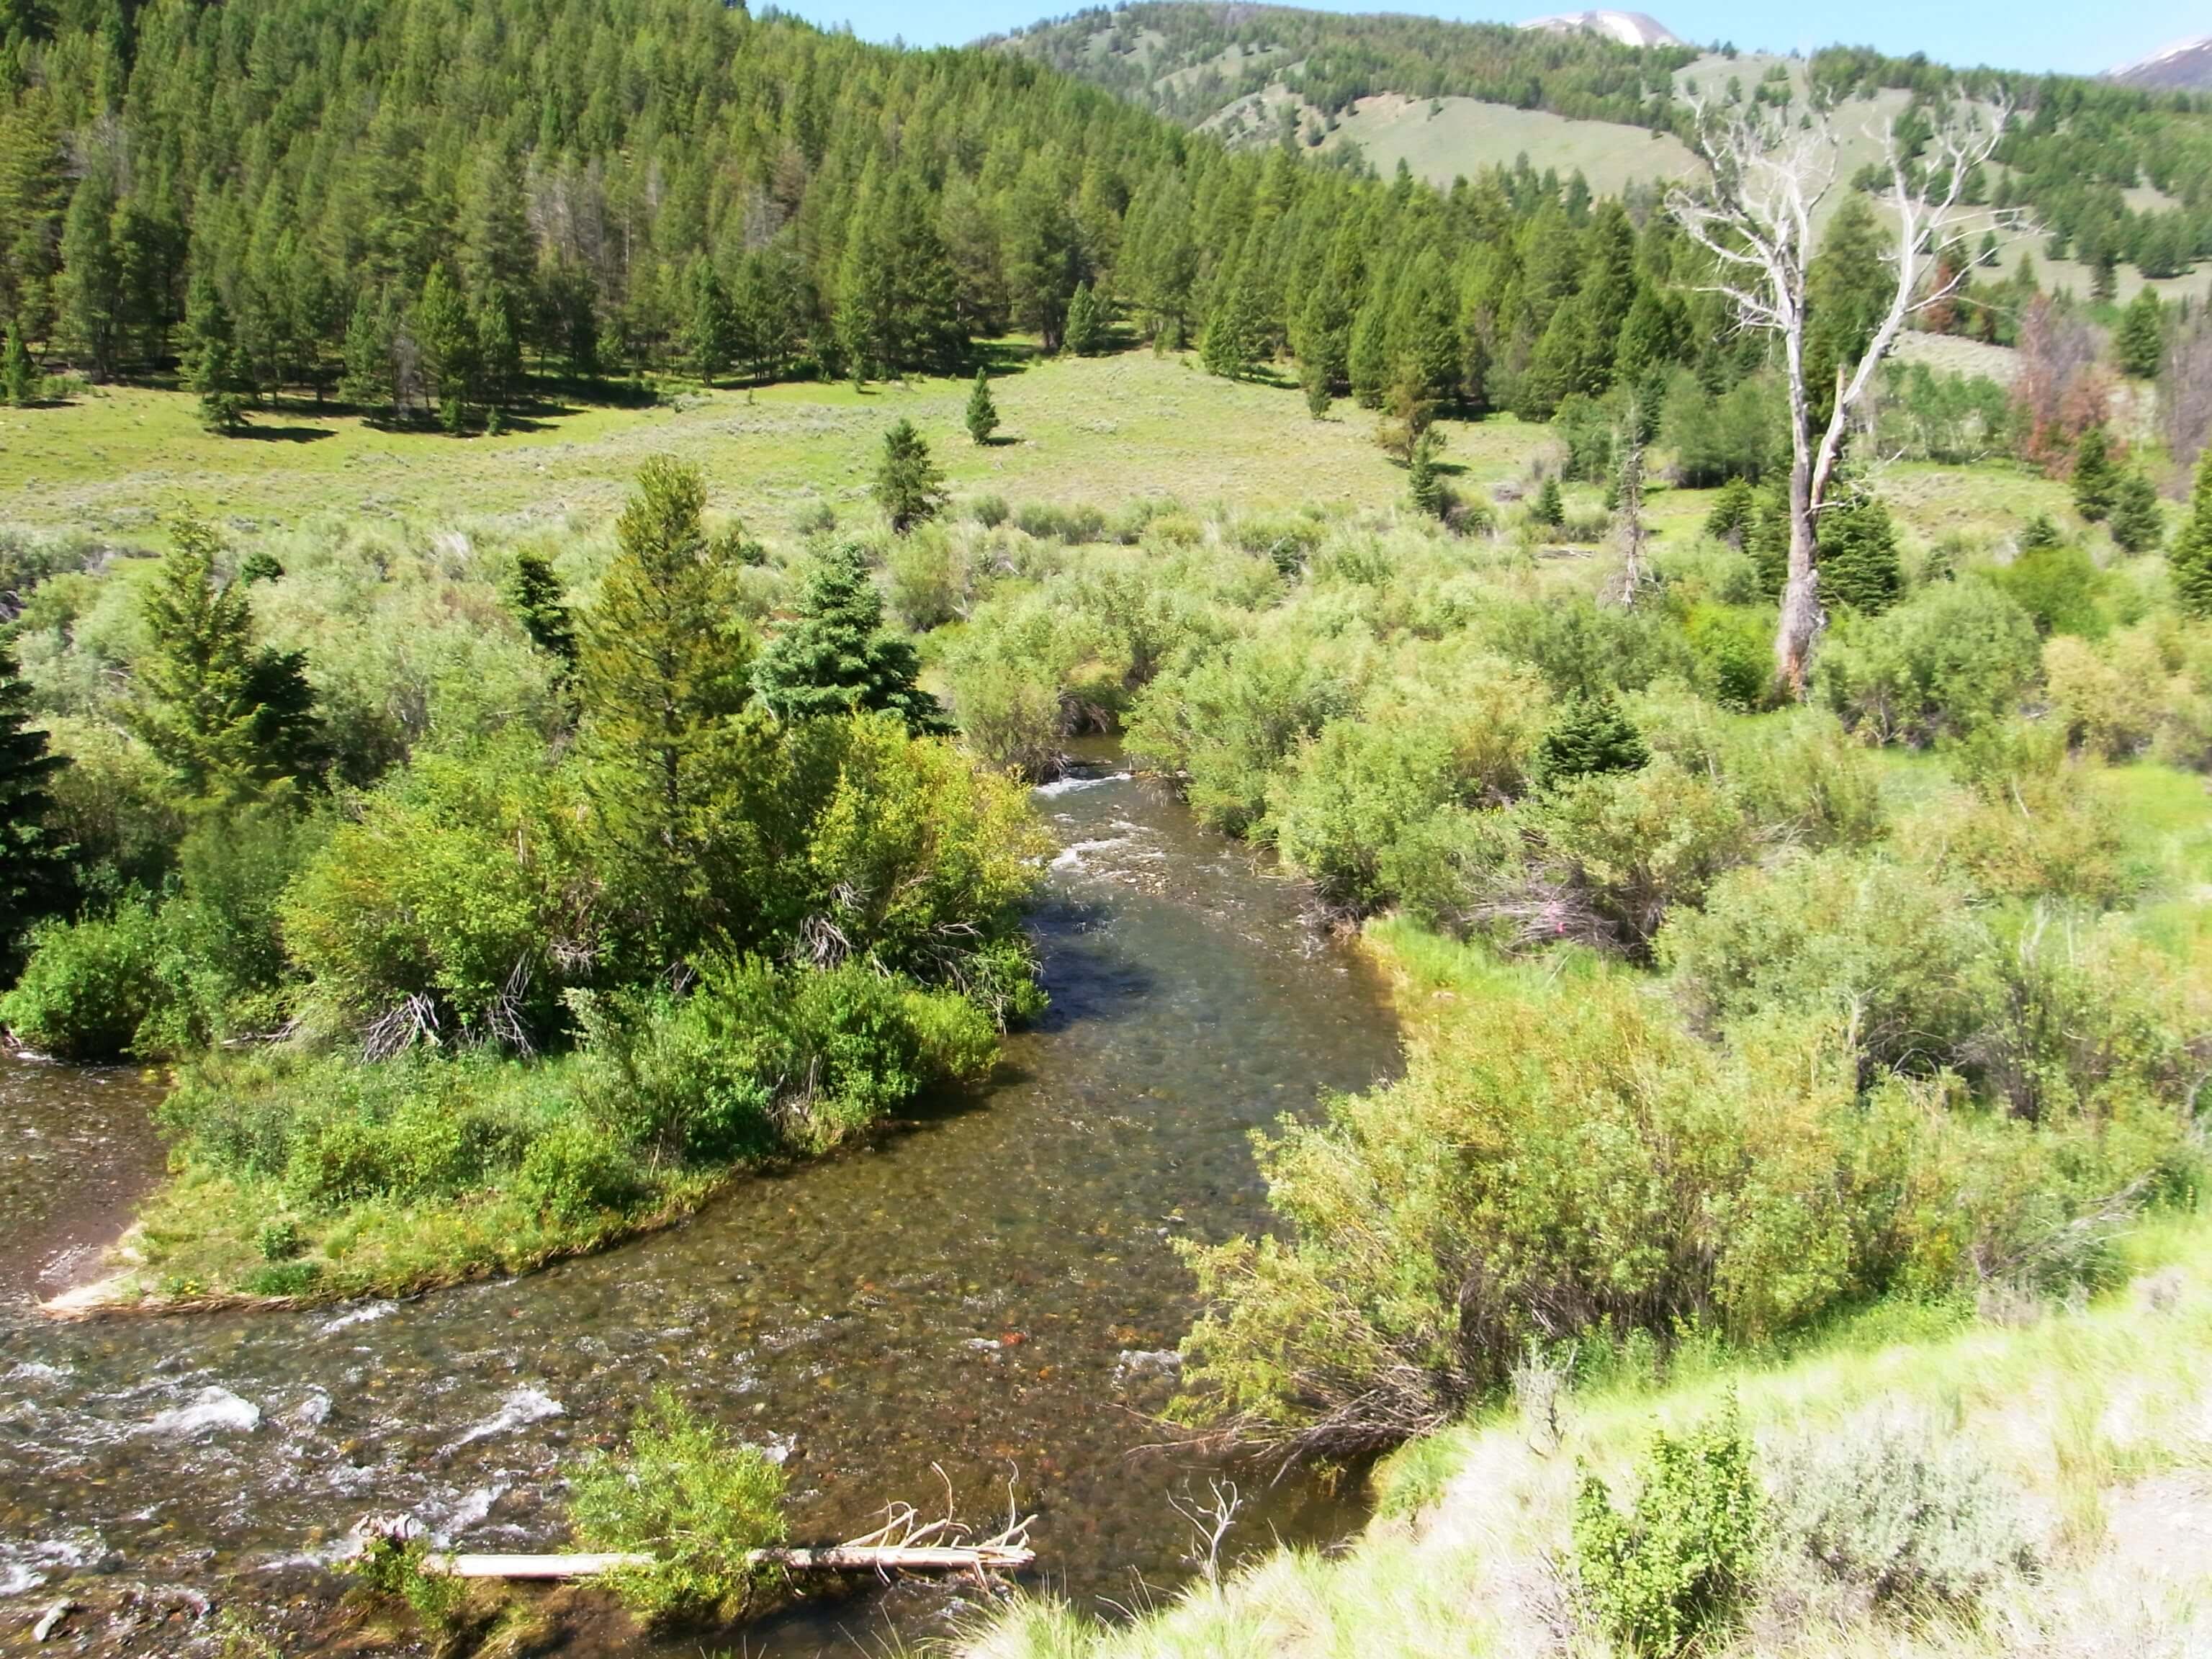
Overview of Bear Valley Creek Studysite looking upstream (Photo © 2010 by Sara Bangen).
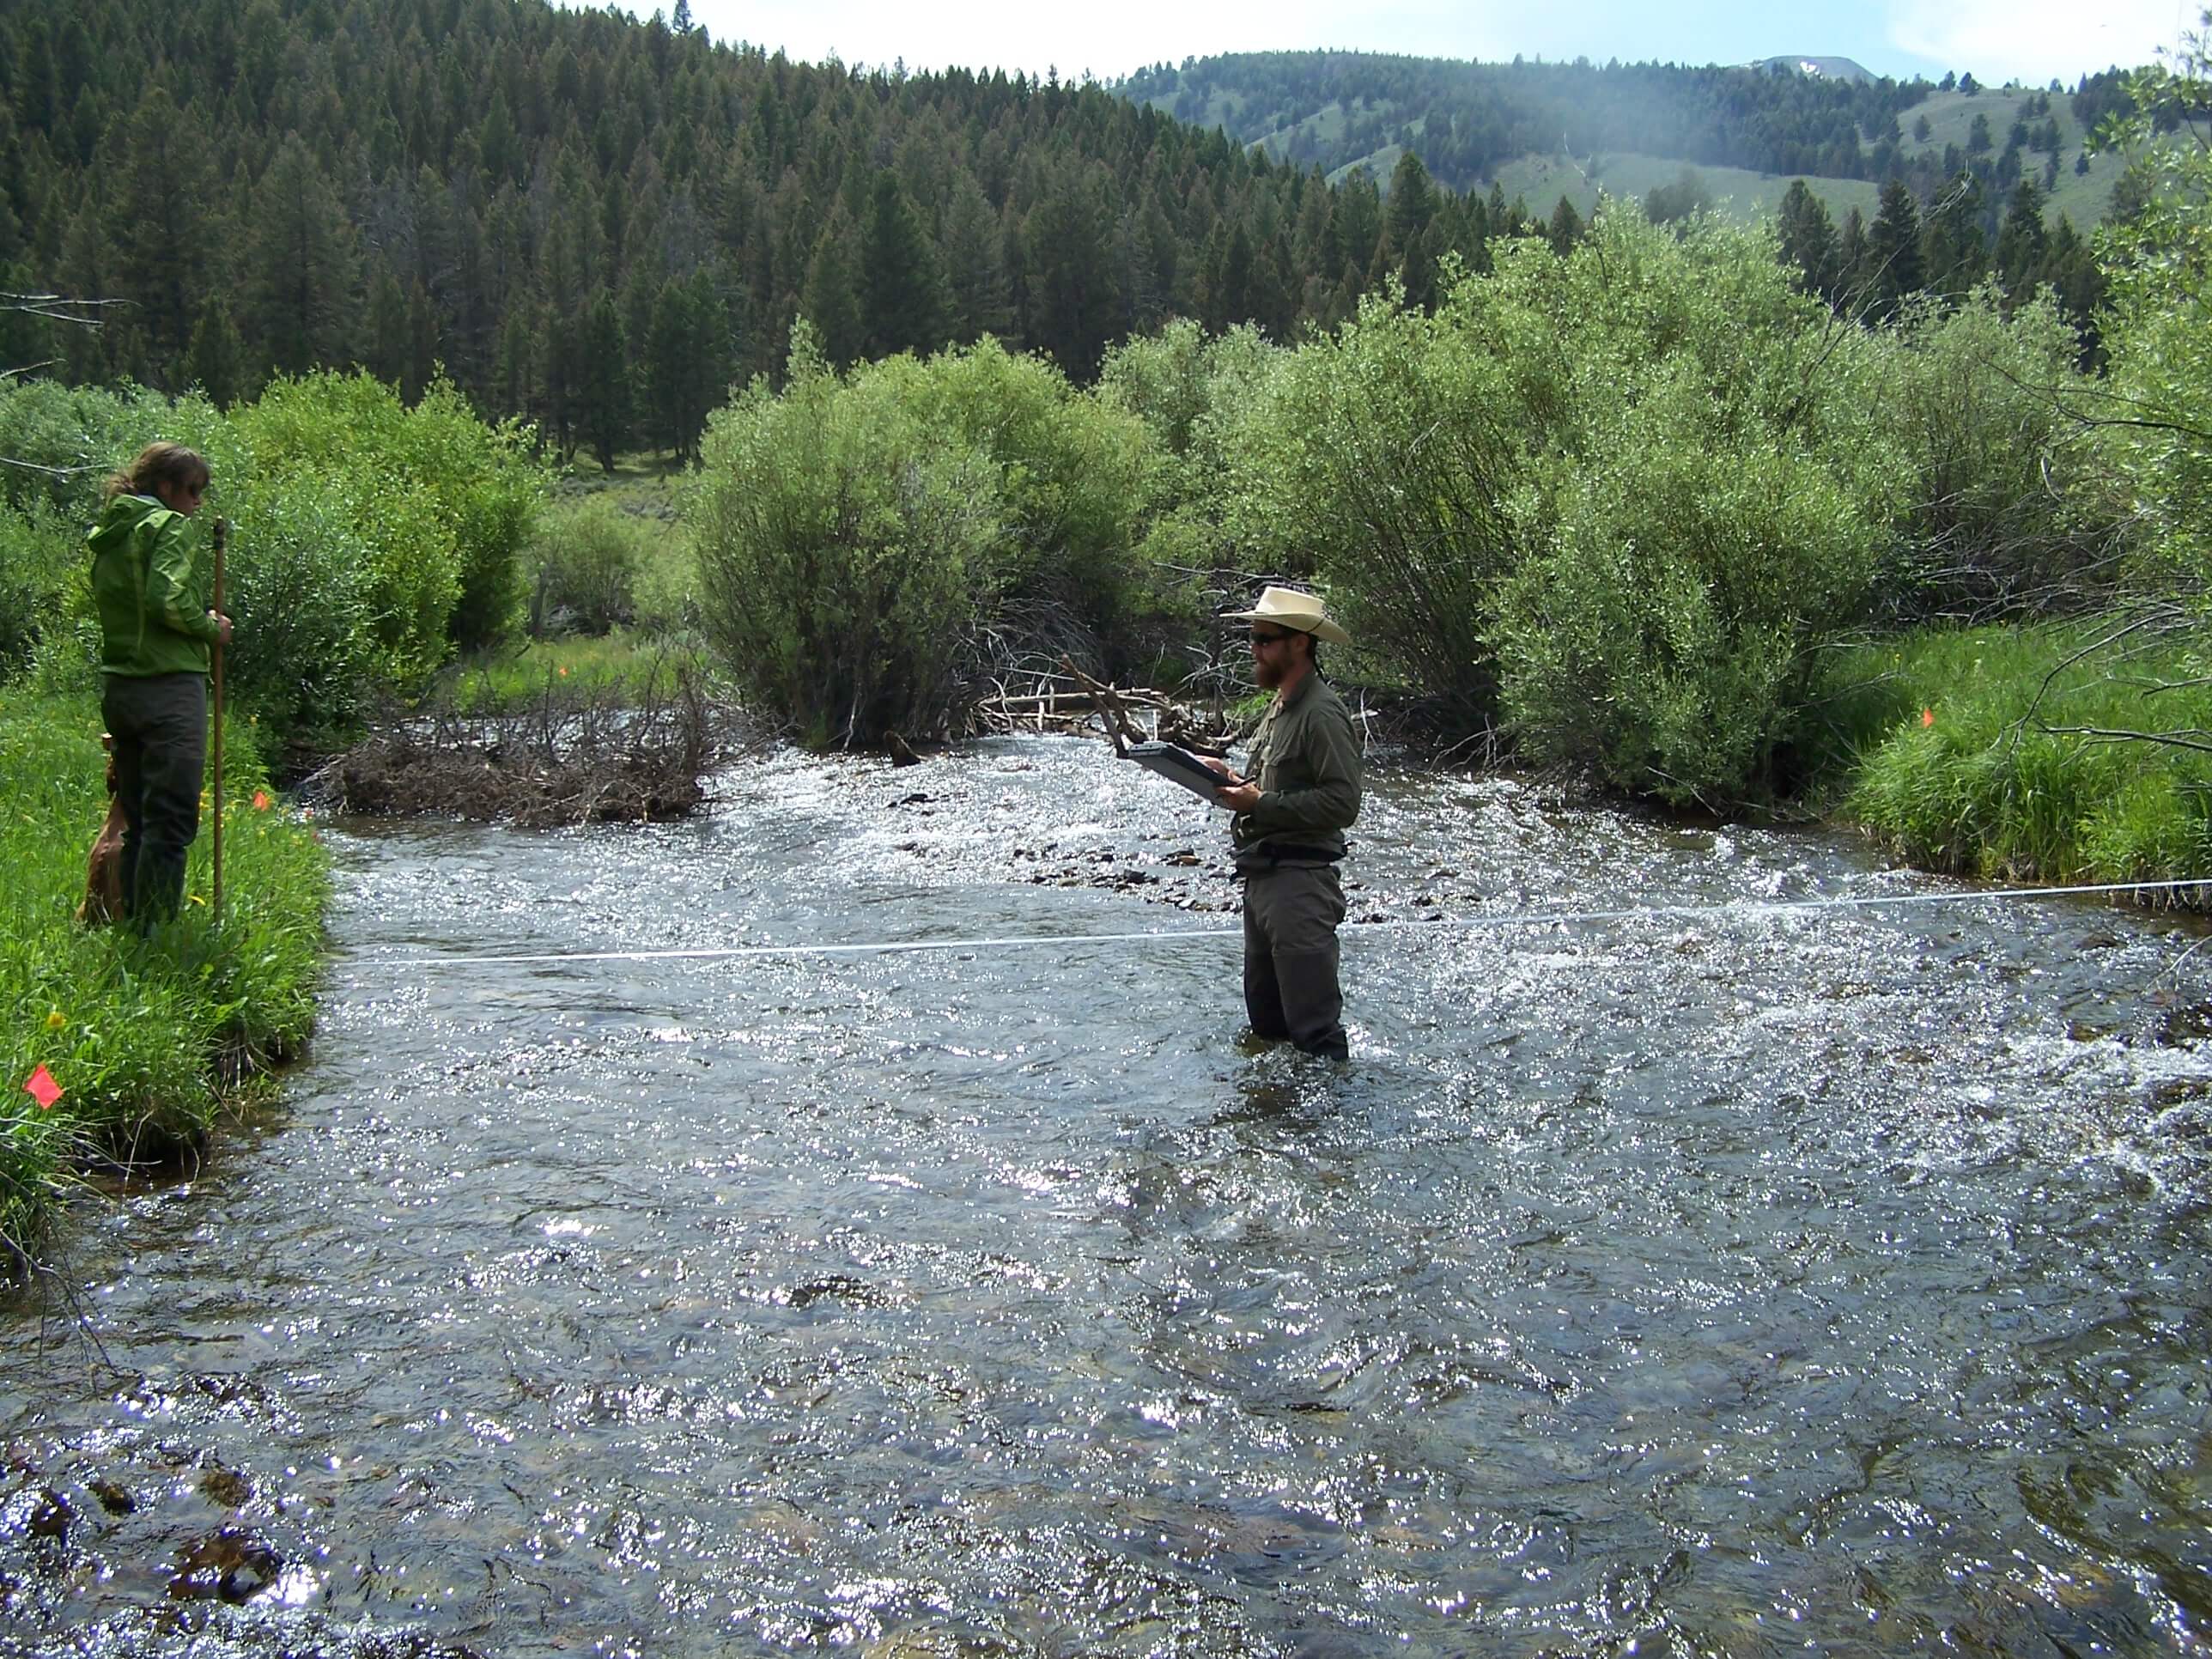
Crew members recording information at a transect during a habitat survey at Study Site (Photo © 2010 by Sara Bangen).
Task 1 - Plot up Unprojected Data
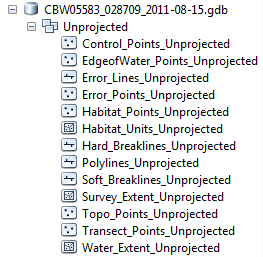
Please download the CBW05583_028709_2011-08-15.gdb.zip![]() file, which contains the
file, which contains the CBW05583_028709_2011-08-15.gdb file geodatabase for the Bear Valley Creek Study Site.
Bring the raw survey data into an empty ArcMap document, and create a map with a measured grid overlay to display the data, denote the different types of data, label the benchmarks, and illustrate that the data is unprojected in an assumed Cartesian coordinate system. While not spatially referenced, this data DOES have scale. It was collected in meters against the assumed grid.
You will notice that there are a number of data layers and some of them are empty. Please ONLY use the following layers for this task:
- Control_Points_Unprojected,
- Topo_Points_Unprojected,
- Hard_Breaklines_Unprojected, and
- Soft_Breaklines_Unprojected
When finished, include a static version of this map in your website. Save your map (maybe as Task 1) and quit ArcMap.
You may wish to wait to export this map until you have finished Task 2.
See here for more Task 1 detailed instructions.
Task 2 - Transform Data
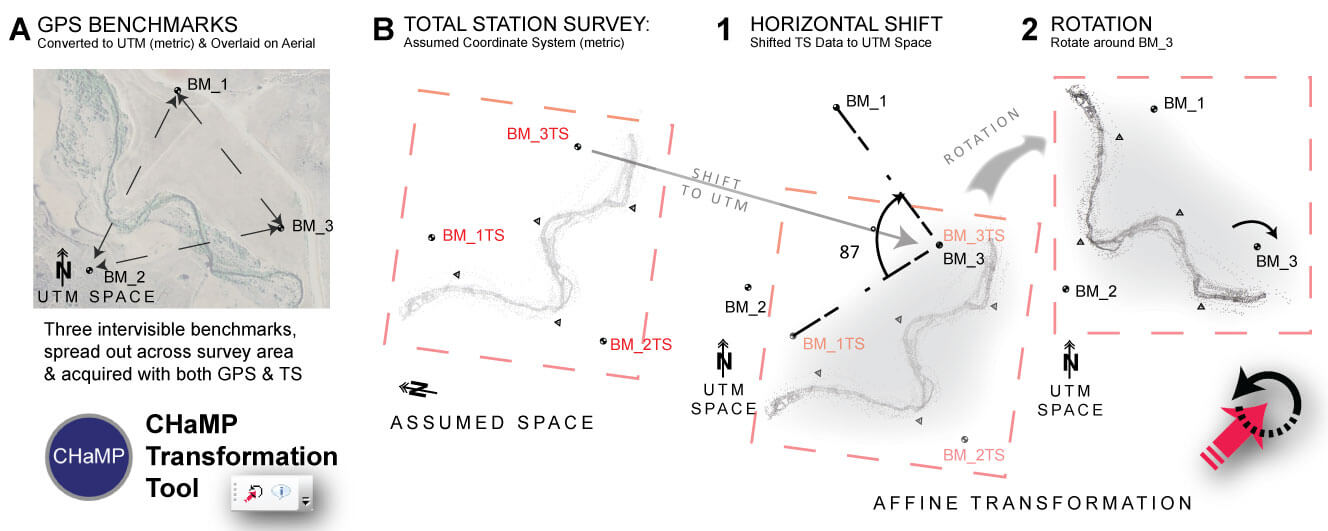
The key to transforming any data from one coordinate system to another coordinate system is having some coordinate values for the same points (typically 2-5) in BOTH coordinate systems. In our case, we want to transform survey data in un-projected assumed Cartesian coordinate space to real world projected coordinates (NAD 83 UTM Zone 12 N), and we have three benchmarks to do it. The benchmarks were surveyed in with both a total station (very precise: +/- 5 mm) in an assumed coordinate system, and in real world coordinates with a very inaccurate hand held GPS (+/- 5 m). However, using the GPS coordinates as a basis for a simple *affine transformation (i.e. a shift, rotate and datum adjustment*), these coordinates will be good enough for GIS overlay purposes. The cartoon below illustrates conceptually the process of shifting and rotating the total station survey data using the GPS coordinates of the same points. In the example below, BM3 is used as the point around which the transformation is based (click on image for larger view). You will use the CHaMP Transformation Tool to help you.
-
Download
CBW05583-028079 Benchmarks.csvand open these in Excel or Notepad. -
Install CHaMP Transformation Tool AddIn
-
Start a new empty ArcMap Document and follow the CTT example here (using your data instead) to transform the unprojected data into projected coordinates using the CTT. Choose the best transformation parameters based on a combination of visual inspection and minimization of residual errors.
- Make note of your residuals for your submission.
See here for more detailed instructions.
Task 3 - Share Transformed Data & Explain It
Once you transform your data, you will know its in the right place if it shows up on the aerial basemap imagery similar to as shown below (this shows a hillshaded DEM and wetted area polygon):
Bear Valley Creek Study Site
Google Earth view of Study Site. You can download a KMZ file here, and turn on a high resolution imagery baselayer for more context in Google Earth.
Please share your transformed data with your audience (on web) in an interactive map format (Google Map like last week is fine, or if you want to try ArcGIS Online Explorer, that is fine too). See What to Submit below for submission expectations.
Remember, if you group your data together to make your kml file -be sure to remove the basemap. You can also use the “map to KML” tool, but again, remove the basemap, first. Save your data as layer files to preserve your symbology. And include a descriptive title, caption, and/or header for your interactive map to provide context for your web audience.
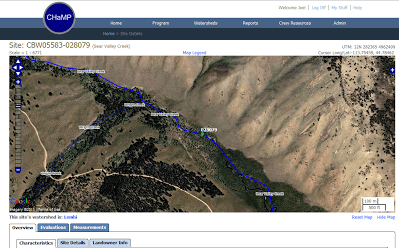
You can learn more about this particular site (CHaMP site CBW05583-028079) here.
Detailed Task Tips & Instructions
What to Submit
The goal of the lab is to georeference highly accurate survey data in an assumed coordinate system to a standard coordinate system so that it can be placed in it’s correct location. But the intrinsic accuracy of the survey data must be preserved. Demonstrate how you evaluated the correctness of the transformation from assumed UTM projected coordinate system.
The most effective way to demonstrate the transformation and effectively convince your audience that it was done correctly is to:
-
make two nearly identical maps of the data before and after transformation.
-
Use a measured grid on each map,
-
- one displaying the assumed coordinate system,
- one displaying the projected coordinate system
- (each grid has a description of its coordinate system)
-
Use the same symbology for each map so your audience focuses on the things that change, not on the bits that are the same.
-
Describe how you evaluated for correctness by explaining visual checks, residual errors, and understanding of skew, scaling, translating, and rotating that might happen during the transformation.
-
Brief introduction & Purpose of Exercise in your own words
-
Results
-
-
Task 1, show a figure of the unprojected data as described above.
-
- In a map caption include the coordinate system and the limitations of the data are in this form.
-
For Tasks 2 & 3, create a figure to display the projected data
-
- In caption describe the coordinate system and how the transformation affects how the data can be used
-
Report the residual errors associated with the transformation.
-
Explain briefly why the affine transformation is a good transformation method for this data and project.
- Explain how you evaluated the success of the transformation.
-
Remember: When building your figure, consider the importance of consistency between the task 1 and 2 data presentations. Make it easy for your viewer to focus on the important differences between the assumed and UTM datasets.
Make sure your lab conforms to the general lab submission guidelines. Please read and follow THESE GUIDELINES for producing your figures!
Submit a URL for this lab’s webpage to Canvas.
Additional Resources
Introduction to Coordinate Systems video:
Coordinate Systems
Projections
Transformation Methods
- Choosing an Appropriate (Geographic) Coordinate Transformation - Its easy to get confused in ArcGIS, with so many types of transformations possible. The vast majority of the transformations available in ArcGIS are between two coordinate systems (geographic or projected), which are already defined. In this lab, you are transforming between an assumed local Cartesian coordinate system and a projected coordinate system.
- Spatial Adjustment (i.e. projected/unprojected coordinate transformations) - In ArcGIS, they bury transformation of vector datasets inside the editor toolbar, underneath More Editing Tools -> Spatial Adjustment. The spatial adjustment we did in this lab is known as an affine transformation (simple shift and rotate), and is one of several different transformation models.
- Georeferencing - The analogous process to spatial adjustment for transforming raster data from one coordinate system to another is known as georeferencing in ArcGIS (also commonly referred to as rubbersheeting or georectification). We will address georeferencing in Labs 9 and 10.
More about Data and Tool You Used Here:
- CHaMP Transformation Tool - The tool you use in this lab to transform data from a local assumed Cartesian coordinate system to a projected real world coordinate system.
- Columbia Habitat Monitoring Protocol (CHaMP) - The monitoring program, which produced the data you downloaded in this lab and reporjected
Follow up Activities:
- Lab 07 - Building DEMs - Task 2 -If you’re curious what can actually be done in terms of spatial analyses with the stream habitat survey data you transformed in this lab, you can peak ahead to Lab 7. In Lab 7 we take topographic stream habitat survey data, and construct digital elevation models from them. CHaMP is using these data to assess the status and trends of salmonid habitat conditions in tributaries throughout the Columbia River Basin.
Relevant Literature:
- Wheaton JM, Garrard C, Volk C, Whitehead K and Bouwes N. 2012. A Simple, Interactive GIS Tool for Transforming Assumed Total Station Surveys to Real World Coordinates - The CHaMP Transformation Tool. Submitted to Computers & Geosciences.42: 28-36. DOI: 10.1016/j.cageo.2012.02.003.
Subpages (2): Task 1 - Visualizing Unprojected Data Task 2 - Transforming Data Using CTT