gis
Here you are going to reproduce a portion of the 1:100,000 scale Logan (30’ x 60’) Quadrangle on an 8.5” x 11” page, which normally fits on a 36” x 26” page. You can either attempt your own workflow that approximates the map shown on the parent page, or follow the potential workflow spelt out step-by-step for you below:
Bring in Data
-
Open a new empty Map Document. Set the map page size (under File *-> *Page and Print Setup) to a portrait letter.
-
First we will bring in the geology layers provided to us. Switch to Data View and add the geology layers in the following order:
LoganBase.tif.lyr, geounits.lyr, geolines.lyr, folds.lyr, mapsymbl.lyr. Double check the ‘correct’ projection has been used and assigned automatically to your data frame. Make sure the geounits layer is adjusted with a slight transparency (e.g. 40%). The layers should appear the same as they do on the PDF from the Utah Geologic Survey website of this map. With all these layers loaded, you will notice that the map is rather slow to redraw. You may wish to turn off some layers you are not actively working with as you proceed and only turn them on as you need them.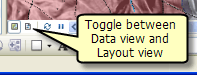
Before you get to far, you may wish to save your map document!
Set up Page
Next we need to set up the layout view data frame so it fits neatly on our page for our area of interest.
-
Switch to Layout View and right click on your data frame and go to properties. Rename the data frame to Geologic Map. Then switch to the ‘Size and Position’ tab where we will adjust the exact position of the data frame on the page. Change the position to X of 1 in and Y of 10 and change the size to a width of 6.5 and height of 6, and as shown in the video. This will allow for a 1 inch margin at the sides and top to allow room for title and grids, and space at the bottom for a legend.
-
Next we need to produce a rectangular shapefile that will coincide with the limits of our data frame at 1:100,000. Create a blank new shapefile of type polygon, projected in the same coordinate system as the geology layers (i.e. NAD_1927_UTM_Zone_12N). Name the shapefile,
NewLoganMapLimits. -
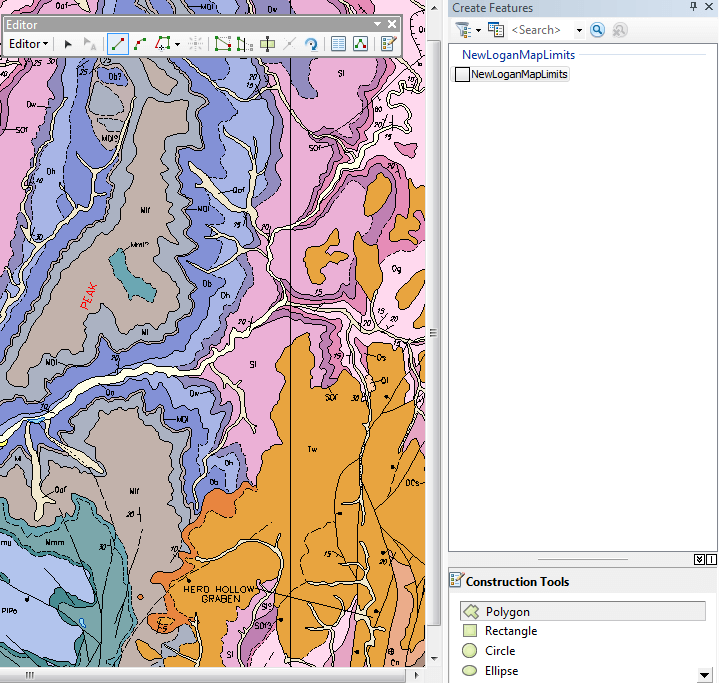
Return to ArcMap and switch to the Data View and make sure the empty shapefile
NewLoganMapLimitsis added into your Table of contents. Make sure your editor toolbar is loaded (right click in the gray area at the top of ArcMap to open list of available toolbars) and start editing the shapefile. -
We will add a singular rectangular polygon to our shapefile, which we can use to clip our data. Unlike previous polygons you may have drawn, this one will be drawn exactly using coordinates. You are asked to produce a portion of the geologic map showing parts of Smithfield, Logan, and Logan Canyon up to the Wood Camp campground. To make your life easier, I will tell you to use an upper left hand corner UTM coordinate of E 426,700; N 4,622,900. Given that your map will be produced at a scale of 1:100,000 and you set your data frame size to 6.5 inches by 6 inches, this means that your rectangle will be 650,000 inches wide (in map units) and 600,000 inches tall. Simply add or subtract these metric values to the given coordinates to figure out what your other three corner coordinates need to be (see video for how).
-
- To start drawing the rectangle, right click on your
NewLoganMapLimitslayer and go to Edit Features -> Start Editing
- To start drawing the rectangle, right click on your
-
- The Create Features box and editor toolbar should show up.
-
- In the Create Features window, make sure that your
NewLoganMapLimitslayer is highlighted and then select type Polygon in the Construction Tools.
- In the Create Features window, make sure that your
-
-
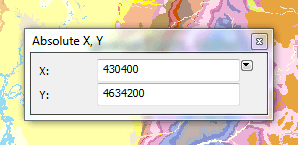
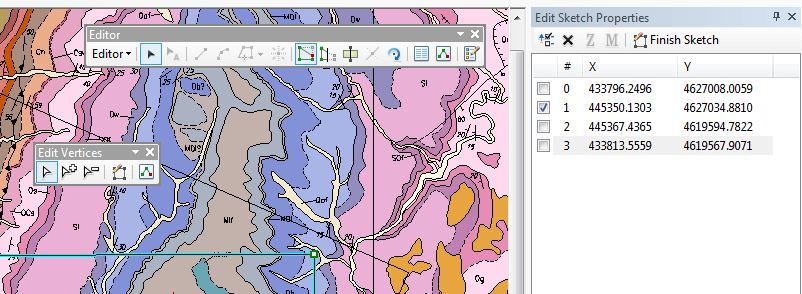
The cursor will now change its appearance as it waits for you to click on the map at a corner of the rectangle. Do not click with the left mouse button! Instead, right click on the mouse and enter your first coordinate using the ‘Absolute X, Y’ option with an X of 426,700 and Y of 4,622,900.
-
-
- The coordinates that appear will be those of the arbitrary map location where you right-clicked to bring up this dialog. Change these to the upper left hand coordinates provided above. Hit enter when done.
-
- Right click to the right of your first point and enter the Absolute XY coordinates of the upper right hand corner coordinate (you need to calculate one of these); hit enter when done.
-
- Right click to the south of your last point and enter the Absolute XY coordinate of the lower right corner.
-
- Right click to the left of your last point (straight south of your first point) and enter the final Absolute XY coordinate pair. Right click and choose Finish Sketch.
-
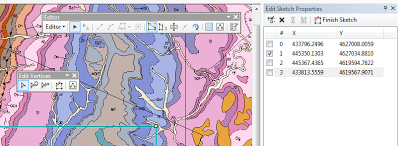
- After you are done, you should have a rectangle of the desired dimensions. You should verify the dimensions by clicking on the edit tool
 in the editor toolbar, clicking on the rectangle you drew to select it, then right clicking and selecting ‘Edit Vertices’ in the context menu.
- After you are done, you should have a rectangle of the desired dimensions. You should verify the dimensions by clicking on the edit tool
-
-
This will bring up both the Edit Vertices toolbar and Edit Sketch Properties window. In the Edit Sketch Properties window you will see values of four coordinate pairs. If any coordinates are wrong (as they are in my example above, you can edit by clicking on individual coordinate values. If instead you want to start over with a new rectangle, stop editing and Don’t save your edits. Or simply delete the rectangle and draw a new one in the same edit session for the
NewLoganMapLimitslayer. -
When you are done creating this rectangle, stop editing.
-
- In the editor toolbar, go to* Editor -> Stop Editing* and save your edits.
- Now so we can see the area beneath the polygon, change the display properties to a hollow symbology so you only see the outside line.
Preparing Data to Display in our Area of Interest
Next we need to clip some of our layers down to just the area of interest. We can physically clip the datasets and create new datasets, or we can use a display clip. We will use both here to learn the differences. First, we want to create a legend of rock unit types and if we use the entire dataset, many rock units outside our map area will potentially be included.
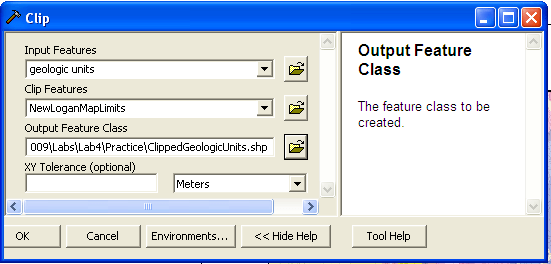
- To clip the ‘geologic units’ layer, navigate to ArcToolbox -> Analysis tools -> Extract -> Clip. Remember Clip works like a cookie cutter, preserving all features (or raster cells) that fall within the geometry of the Clip Features. Use the Tool Help (click on the actual text ‘Input Features’ or ‘Clip Features’) to see definitions that differentiate these layers. Name your output and save to a deliberate location:
-
Now you should be able to turn off the original geologic units layer (or even remove it) and see your clipped geologic units layer of just the region of interest. Now we have a problem; the display properties of the new layer don’t match those of the original! To fix this, you could manually go through and change all the symbology properties. However, it is much easier to go to the symbology properties tab of the layer (right click the layer in the table of contents > Properties > Symbology) and click the ‘Import..’ button. This allows you to import the Symbology Properties from either another loaded layer in your map document (i.e. geologic units in our case) or any saved layer file on your machine (e.g.
geologic_units.lyr). It will ask you which field these symbology definitions should be applied to (in our case the suggested match is correct). Now your colors are back (note that transparency levels are not imported with the symbology as this is a display property). -
You can clip any feature class (polygon, polyline, or point), based on another polygon. You could clip all the USGS map layers and import the existing symbology. However, you do not need to!
-
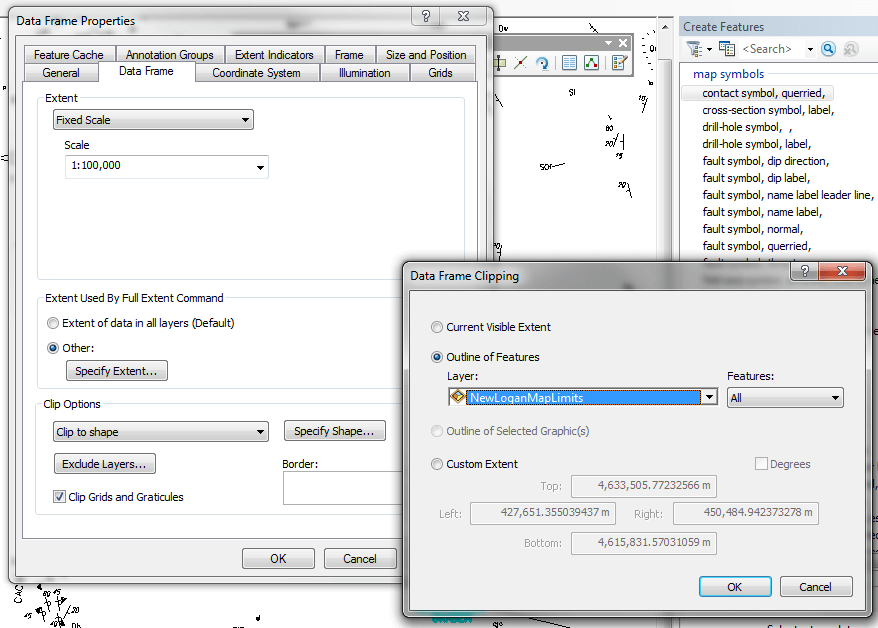
As mentioned above, physically clipping existing layers to create new data sets is not the only type of clip you can do in ARC. You may wish to keep all the original data in its original files, but simply implement a display clip. To see how this works, turn off the Clipped Layers group you just created. Zoom to the full extents of the original data and turn on the Original Data layers. Right-click on the Geologic Map Data Frame > Properties > and navigate to the ‘Data Frame’ tab. In the “Clip Options” section set the first drop down to ‘Clip to Shape’. Use the ‘Specify Shape’ command to select the
NewLoganMapLimitslayer as shown below. Click OK and OK.
-
This does not physically remove the data from the original data layers outside the clip area. It simply turns it off so it is not in view. This looks exactly the same now as the clipped datasets we used.
-
Your Table of Contents (layer organizer - left pane) is probably somewhat disorganized now. Using the control key, select all of the layers you have produced that are the products of clipping. Right click on any of the highlighted blue layers, and select ‘Group’. This moves all these layers to a collapsible group. Rename the group Clipped Layers. Select the original unclipped layers and create a group of them called ‘Original Data’. You can now turn on and off all the clipped layers at once or all the original data.
-
If you zoom in and look closely, you will notice that the
map symbolslayer is of type polyline, and the ‘labels’ and ‘symbols’ themselves are simply line work (i.e. what looks like a letter is really made by polylines) as opposed to smart annotations or text labels. The Utah Geologic Survey used this option so that their symbols always look the same, which may be advantageous. It does however mean that the functionality is very different and labels and symbols are not automatically scaled when zooming, nor do they adjust their position for overlap conflicts, nor do they lend to producing legends automatically in the same way. You can edit and delete those annotations that are on the border of the map and cut off (see video).
Just FYI:
- You COULD also clip raster layers such as your loganbase.tif background USGS map. There are various ways to do this, but one way is outlined here. Navigate through the ArcToolbox to Data Management Tools -> Raster -> Raster Processing -> Clip (Note: this is a different tool than the clip command you used in the Analysis Tools. The Analysis Clip tool only works for clipping vector data). Select the
loganbase.tifto be clipped and use theNewLoganMapLimitsas the Output Extent as shown below. Don’t forget to specify where you wish to save the new layer. Notice that the rectangle coordinates are populated based on the extent of your Output Extent layer and the values are the same as those typed in when you were creating the polygon. If you were clipping using a polygon with an irregular shape (like a watershed), you could force the raster to be clipped according to the irregular features (as opposed to the rectangle) by checking the ‘Use Input Features for Clipping Geometry) box. For our example, that option is irrelevant.
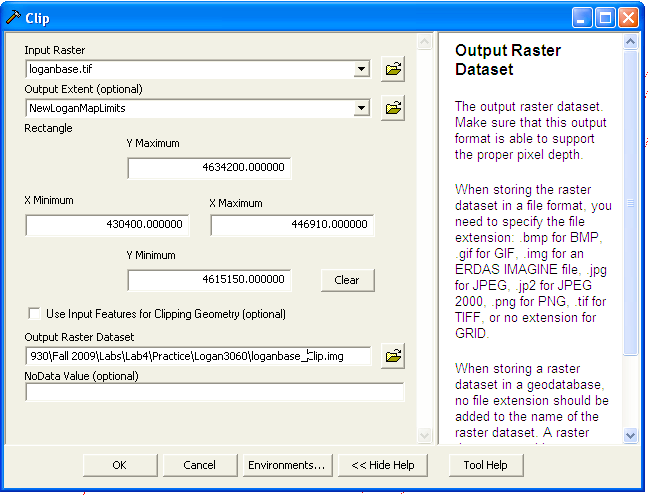
- The new clipped raster should show up in your view.
Adding a Grid and Graticule
Most USGS maps have grids showing around the map collar for both a State Plane and UTM projection as well as a graticule showing for latitude and longitude. In addition they typically show the PLSS grid on the map. Because we’re using a USGS basemap as our bottom layer we have the PLSS grid showing, but now that we’ve clipped our view we have lost the other grids. The video shows us how:
-
Here we will create two new reference grids for the collar based on UTM and Latitude and Longitude. Open the Data Frame Properties dialog and switch to the Grids tab. Click on New Grid and in the first dialog select ‘Graticule’ and click next. In the next dialog, change the appearance to ‘Labels only’ and change the intervals for every 5 minutes 0 seconds on both the parallels and meridians. Use the defaults on the next two screens and click finish. Click Apply then OK and view your grid.
-
Using these settings will present the easting and northing UTM ticks in the same unintuitive convention you are used to seeing on USGS maps (e.g. 4310000 E) and position the labels to minimize conflicts with the latitude and longitude labels.
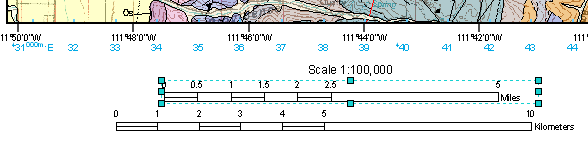
Scale Bar
Next we will add two scale bars, just as you see on the base of the 30’ x 60’ geologic map that your map is showing a portion of.
- First add a scale bar and change its display properties to look roughly like the miles bar (i.e. use a hollow scale bar with 2 divisions, 5 sub divisions, change the division units to miles). Make the scale bar cover 0 to 5 miles). To make the second scale bar you can either add a new one or copy the original and change its units to kilometers and stretch it out to 10 kilometers. Finally add a text box above the scale bars indicating the ratio scale and center everything. It should look roughly like below:
Adding a Legend
Next we need to add a legend. Our legend will not be as complete as the original map legend, but it will show the different rock unit types, contact, and fault types. We will show you a workflow in this video that gets you the Legend building blocks you need for export to Adobe Illustrator.
-
First make sure the Geologic Map data frame is active (i.e. bold, you can do this by right clicking on it and clicking Activate).
-
Go to Insert -> Legend. In the Legend Wizard, use the single left and right arrow buttons to make sure that only
ClippedGeologicUnitsandgeolines_Clipare showing in the Legend Items list. Change the number columns in your legend to 6, then click next. -
Change the Legend Title to Rock Unit Abbreviations and use the defaults through the next few wizard dialogs and click finish to make legend.
-
You’ll notice it covers most of your page and shows way more rock units then are actually present. This is because we imported the symbology for this layer (so we had all the right units) from the layer file provided to us by Utah Geologic Survey. We need to get rid of all the irrelevant geologic units not shown on the map. This is why the display clip doesn’t work for this exercise. A display clip doesn’t actually reduce the size of the dataset, so all the original geologic units are still there and the legend would be unwieldy.
-
If you go to the Geologic Units layer Properties and navigate to the Symbology tab, you will see the list of all layers and under the count column there will be question marks. To update the count column simply click on the Count header. Now you can go through and individually remove rock unit values by clicking on those with a 0 count and pressing remove. Notice that the legend order is in order of the age of the rock units (don’t change this). Click apply and OK when finished.
-
Resize the legend box so it fits below your scale bars.
-
Next we need to fix some of the display properties of the legend itself. Right click on the legend and bring up the Properties dialog. Go to the Title Tab and make sure the title is Rock Units, then switch to the Items tab. Click on the style button and then in the Legend Item Selector click on Properties. Under the General Tab, uncheck the check boxes for ‘Show Layer Name’, ‘Show Heading’ and make sure ‘Show Labels’ is clicked on. Click OK (three times) and exit out of the Legend Properties.
-
Notice that only the abbreviations are shown for each rock unit. We want both the abbreviations and the full rock unit names to show. We can either edit each item description individually, or use a simple analysis tool (the field calculator) to combine to attribute fields into one for the purposes of legend display:
NOTE: The following steps have been labeled by some as an exercise in futility. Please read all the way through this set of 6 bulleted instructions before proceeding.
-
- First, save your Clipped Geologic Units as a new dataset in case we mess this one up. Right click on the layer to bring up the context menu and navigate to Data -> Export Data and save this as a new shapefile called
UpdatedClippedGeoUnits.shp. Click No when asked to add as new layer.
- First, save your Clipped Geologic Units as a new dataset in case we mess this one up. Right click on the layer to bring up the context menu and navigate to Data -> Export Data and save this as a new shapefile called
-
- Next save your Clipped Geologic Units as a layer file (so display settings can be recalled). Right click on the layer and go to Save as Layer File.
-
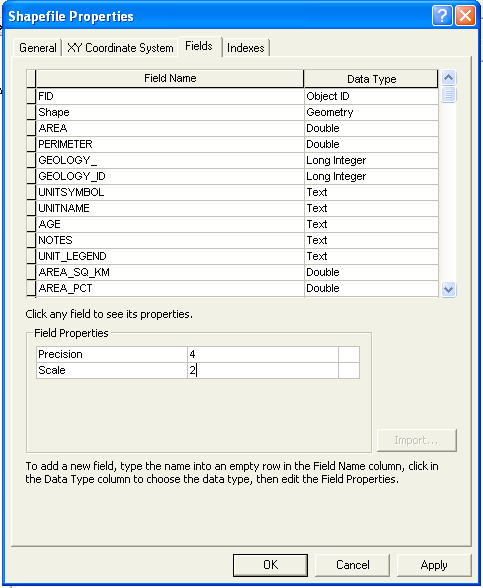
- Next we need to add a new field to your UpdatedClippedGeoUnits file. Open Arc Catalog and right click on the shape file and go to Properties. In the Fields tab, add a field UnitLegend of type text and length 80. Click Apply then OK and return to ArcMAP.
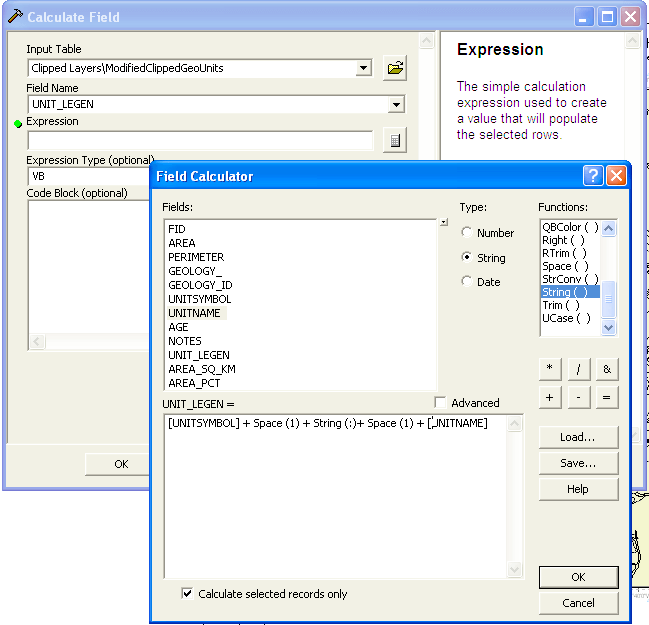
- Add your
UpdatedClippedGeoUnits.shpshapefile to the Geologic Units Data Frame. Open the Attribute table and notice the new field you made is empty. Now we want to populate the UNITLEGEND field with both the Unit symbol and the Unit Name (separated by a space and dash). To do this, go to Arc Toolbox -> Data Management Tools -> Fields -> Calculate Field. Select theUpdatedClippedGeoUnits.shpfile as your input table, and UNITLEGEND as your field-name (place where new field data will be stored). Click on the calculator button to bring up the field calculator. Change the type to string, then enter the following: [UNITSYMBOL]+” : “+[UNITNAME]. Click OK and then OK. The image below is outdated use the code above.
-
- Now when you refer to your attribute table under the UNITLEGEND field you will have both fields combined with 3 spaces between them. Read about other useful field calculations here.
-
- Now we can have these new combined Unit Symbol and Unit Name fields shown in our legend. Unfortunately, you’ll find that you would have to manually modify the color maps of each rock unit. If you attempt to import your layer symbology from the previous layer, it will bring the text label with it and over-write it. Probably the easiest thing if you were to do this manually is to expand both layers in the Display layer tree and click on each layer one at a time and manually copy and paste each label back to the original layer. YOU DO NOT HAVE TO DO THIS. I just wanted you to see how you could use field calculator and how it solves one problem and creates another…. Just turn off this newly created layer and use the ClippedGeologicUnits (it fits better on our small page anyway).
-
Finally, add a legend for the geolines layer and place it at the bottom of your map. Don’t forget to update the count in the symbology and remove those irrelevant categories like you did for the rock units.
- Next we will add titles and notes. You should refer to the PDF of the geologic map (http://geology.utah.gov/maps/geomap/30x60/pdf/i-2210.pdf) for a rough indication of what needs to be included. Since this is a going to be an excerpt of an existing geologic map, we will not include everything, but instead cite the original map. Across the top of your map you can add a title along the lines of: “A Portion of Geologic Map of The Logan 30’ x 60’ Quadrangle, Cache County, Utah”. Beneath it, you should add a subtitle to the effect of “Originally Produced by J.H. Dover (1996) of Utah Geological Survey, Reproduced by Your Name (2014), Utah State University”. In the lower right corner in a small (e.g. 6 point) font add the notes:
Base layer from U.S. Geological Survey, 1984 Projection and 1000-meter grid zone 12N UTM (shown in blue ticks along interior edge of map). 1927 North American Datum. Geologic layers from Utah Geologic Survey map entitled ‘Geologic Map of the Logan 30’ x 60’ Quadrangle’, by J.H. Dover (1996) available from http://geology.utah.gov. . Refer to original map for full legend, rock unit descriptions, stratographic column and unit correlations.
Build a Location Map
- From the Insert Menu, insert a new data frame and rename it Location Map. Switch to the map view for this location map. Add a state outline for the state of Utah (remember you can get these from the Utah GIS portal, among other places). Change the display properties to show only a hollow state line for Utah. Next, switch back to the Layout View and right click on the display properties for the Location Map Data Frame. Switch to the Extent Rectangles tab and add the Geologic Map data frame to your list for ‘Show extent rectangle for these data frames’. You can adjust the display properties of the frame if you desire. This will show a box (or dot if map is small) depicting the map location in Utah. Add text labels for the state and location map.
####
North Arrow
Add a discrete north arrow at some location that does not clutter the map (note: the USGS normally depict this with a magnetic declination arrow from true north… we won’t… but you can dig into it if you want.
Read about magnetic declination here, Read about how to calculate magnetic declination for a specific place and time here. Read this to learn about setting calibration angles in ArcGIS 10.1. .
Export
Save your map and export it as both an image and a PDF. You will present these on your website.