gis
Important Dates & Links
Lecture Date(s):
See Calendar
Reading Assignments
See Here for Reading Assignments
Lab Assignment(s)
Background
Introduction to Data
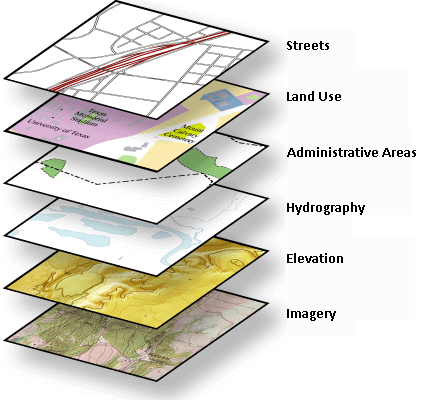
GIS is all about data and until you appreciate how to manage that data, you can never really unlock the power of GIS. Both GIS and CAD (computer assisted drafting) can be used to make maps (in CAD often thought of instead as a plan). Both rely on the concept of layers to overlay information (see left). The fundamental difference between GIS and CAD is the way in which they represent spatial objects on these layers. In CAD, you draw spatial objects (e.g. lines, polylines, polygons, solids, etc.) that are referred to as entities and these reside in a drawing. By contrast, in GIS you don’t draw per se, but instead you load a reference to data (e.g. in ArcMap you use the Add Data tool  ), which you choose how you want to display. Although CAD can be used to do GIS-type things, and GIS can be used to draw, neither are very good at doing what the other was fundamentally designed to do. In CAD you can draw very accurately and precisely with a multitude of options. This is extremely useful for design work, in which you want to create something. In GIS, spatial data lies behind everything. GIS is much more powerful then CAD when it comes to doing analyses, querying data, and managing large quantities of data. Over the next two weeks, we will help you better understand where data comes from and how it is manipulated in GIS.
The power of layers in GIS:
Why we’re Covering it
You should be aware of the plethora of data sources from which you can get GIS data and use it for context or analysis, and how to edit and make your own data. ArcGIS makes some of these choices so easy for you that you can get yourself in trouble. These skills will be crucial in your projects and the if you intend to use GIS in your career to do more than just make location maps (i.e. lab 01).
Learning Outcomes
These lectures, readings and Labs 03 & 04 all help fulfill primary learning outcomes 1, 2, 3 & 4.
Lectures and Podcasts
Quiz 2
Did you like Quiz 2? Most people find it frustrating and time consuming. However, it really puts into practice the concepts we talked about last week with projections and coordinate systems on a paper map. If you’d like further explanation on the Quiz answers, check out this PODCAST.
Vector Data, Editing & Attributing Data + Metadata
At some point, you will want to modify some data someone gave to you, and you’ll need to know about editing. In ArcGIS, editing is both ‘editing’ and another way of saying drawing. We will cover the somewhat confusing workflows and terminology that unlock the door to making GIS a much more powerful tool for you.As far as topics go, metadata is about as dull as it gets…. However, without it a lot of data is worthless. We will go over how to use metadata and how and when you should produce your own metadata. We will then talk about how this metadata is critical to displaying data correctly.
-
2015 Lecture Slides - PDF
-
- See here for individual topic PODCASTs or watch whole series.
Previous:
-
2014 Thursday Lecture - PDF
-
2013 Tuesday Lecture - PDF
-
2012 Tuesday Lecture - PDF w/ 2 slides per page
-
2012 Tuesday Lecture - PDF w/ 6 slides per page
-
- 2012 Video of Lecture
NOT THE PODCAST! - 2012 Lecture For Reference
Raster Imagery, Data Sources & Intro to Remote Sensing
We will go through an overview of raster imagery basics with a review/intro to remote sensing. We’ll then talk about some of the places you can acquire raster and vector data to use in your own maps (e.g. for the Reproducing Maps… Geologic Map lab).
Previous:
-
2014 Thursday Lecture - PDF
-
2013 Tuesday Lecture - PDF
-
2012 Tuesday Lecture - PDF w/ 2 slides per page
-
2012 Tuesday Lecture - PDF w/ 6 slides per page
-
- 2012 Video of Lecture
NOT THE PODCAST! - 2012 Lecture For Reference
TLS Demo - Getting Lots of Vector Data
This year we did the TLS Demo and Synthesis of GIS Fundamentals in One Go
2015 Thursday Lecture - PDF
Previous Years:
- 2014 2014 Thursday Lecture - PDF
- 2012 Thursday Lecture - PDF w/ 2 slides per page
- 2012 Thursday Lecture - PDF w/ 6 slides per page
- 2012 Video of Lecture
NOT THE PODCAST! - 2012 Lecture For Reference
Additional Resources
Data Sources
- GIS Data Links - This is a page I maintain with some links to downloadable GIS Data sources
- GIS Class LibGuide - This is a custom page our librarian has put together just for this class!
- Datasets Provided with ArcGIS - These are known as ESRI Data and Maps
- A quick tour of ArcCatalog - ArcCatalog is the place to manage and browse your GIS data with ArcGIS
- Adding data from ArcGIS online - There are wealth of great basemap layers you can now load into your maps without having to download anything! Very convenient!
WMS - Web Mapping Services
You can add data directly into ArcGIS from a WMS. See here for how to add a WMS in ArcGIS.
- WMS from the Seamless Data Warehouse (includes National Elevation Dataset, Landcover and Imagery)
- Virtual Utah - from RSGIS Lab
- Inside Idaho WMS
- Oregon Imagery Explorer
- GEBCO Web Map - General Bathymetric Chart of the Oceans
- OGC Public WMS Server List
Metadata & Displaying Data
Editing & Attributing Data
- What is editing (in ArcGIS)
- A quick tour of editing (in ArcGIS)
- About creating and editing annotation (in ArcGIS)
- About editing attributes (in ArcGIS)