joewheaton.org
Joe's personal web pages
Home > Research > Projects
Morphological Sediment Budgeting
Uncertainties in Digital Elevation Models & Interpreting Morphological Sediment Budgets
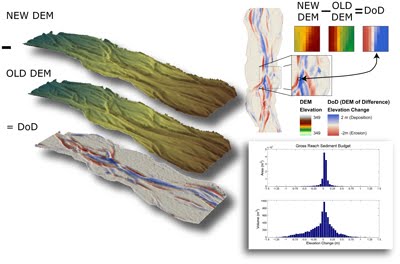
Repeat topographic surveys are often used to monitor geomorphic change in rivers. These yield digital elevation models (DEMs), which are differenced against each other to produce spatially distributed maps of elevation changes called DEMs of difference (DoD - See Figure below). Both areal and volumetric budgets of erosion and deposition can be calculated from DoDs. However, questions arise about the reliability of the analyses and what they mean. This project was the focus of my PhD Thesis (Wheaton 2008 ~ read abstract), which sought to address these two uncertainties (unreliability and structural uncertainty) through development of new analytical and interpretive methods. These tools are available as GCD (Geomorphic Change Detection Software).
Background
Digital elevation models (DEMs) are ubiquitous in geomorphic studies, yet the uncertainty in their representations of the earth’s surface are rarely accounted for (Wechsler 2000 & 2003). Morphological sediment budgets are derived by subtracting the DEM of an earlier survey from the DEM of a later survey (e.g. Brasington et al. 2003; Church et al. 2001; Milne and Sear 1997; Fuller et al. 2003). The so-called DEMs of Difference (DoD) represent an estimate of the change in storage terms over the time step between the surveys. Most studies ignore uncertainties in DoD calculations, and those that have considered it explicitly (e.g. Lane et al. 2003) typically assume that these uncertainties are spatially uniform.

A Schematic of the morphological method. On the left, an example of a DoD (bottom) derived from the two DEMs above it is shown. In the upper right, a plan form perspective of that DoD is shown, and and the inset maps show how the DoD is calculated on a cell-by-cell basis by subtracting the elevation values in the older DEM from the newer DEM. In the lower right is an example of an areal (top) and volumetric (bottom) elevation change distribution from the same DoD. (Figure 3.5 from Wheaton (2008) ©).
Methodological Development
In this research, we have developed techniques to:
- Quantify spatially variable elevation uncertainties in individual DEM surface representations with a fuzzy inference system
- Propagate spatially variable elevation uncertainties from two DEMs through to assess their influence on a DoD estimates probabilistically
- Update these probabilities using a spatial neighborhood analysis and Bayes Theorem, which assess the likelihood that changes are real based on the changes in nearby cells
- Segregate the budget results and elevation change distributions with geomorphologically meaningful masks
Minimum Level of Detection Threshold Sensitivity

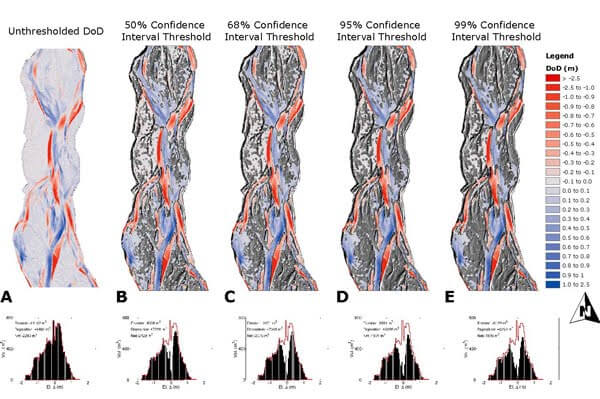
An example of DoD sensitivity to confidence interval threshold minimum levels of detection (minLoD). Confidence Intervals: A) Unthresholded, B) 50% CI, C) 68% CI, D) 95% CI, E) 99% CI. Note the gross non-thresholded values are plotted in red on each volumetric elevation change distribution (bottom) to indicate information loss. Example from River Feshie, Scotland. (Figure 4.33 from Wheaton (2008) ©)
A Geomorphic Interpretation Mask
Typically, DoDs are only used to give gross reach scale estimates of volumetric change and make qualitative interpretations of sub-reach and bar-scale changes. By using simple spatial masks, the budget can be segregated by any classification deemed useful to interpreting the DoD. Some examples of masks developed and tested in Wheaton (2008) include:
- Standard classifications (e.g. geomorphic classification, habitat classification, ecohydraulic habitat suitability model results, sub-reach classification)
- Classification of Difference
- Geomorphic Interpretation (expert-based)
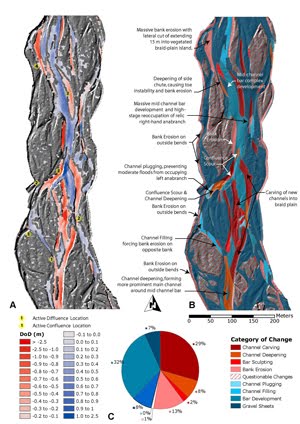
An example of a geomorphic interpretation is shown at left.
Map of the 2004 to 2005 DoD (A), its geomorphic interpretation (B), and the relative proportion of each category of change (C). Relative proportions are calculated volumetrically with reference to the total volume of material net change recorded by the DoD (both erosion and deposition). The flow direction is up the page. Example from River Feshie, Scotland. (Figure 8.7 from Wheaton (2008) ©)
Ecohydraulic Significance
There are a variety of ways that the significance of geomorphic change to physical habitat (e.g. for fish) can be assessed. In Wheaton (2008) various types of masks were used to break up the budget. Examples include:
- Redd surveys - to look at what changes took place where salmon spawned (i.e. changes due to spawning activity or floods and/or implications for embryo survival)
- Habitat quality predictions (from ecohydraulic model simulations)- to look at how certain types of geomorphic changes influence habitat quality
- Habitat quality differences - comparison of habitat quality before and after
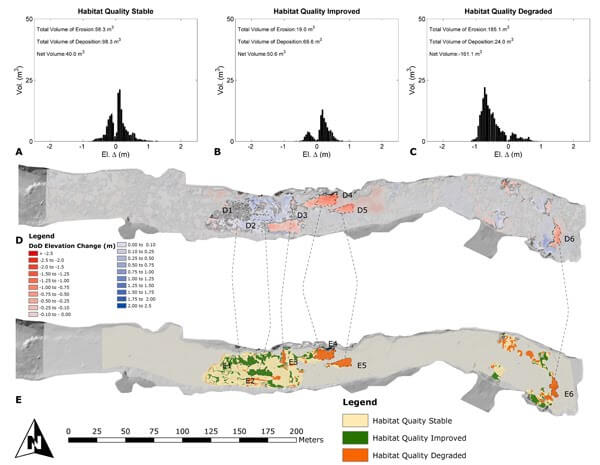
An example of a comparison of change in habitat quality according to DoD recorded changes in morphology is shown below.

The elevation change distributions (A-C) from masks based on a habitat quality (defined by 2D ecohydraulic model simulations) classification of difference (E - see also Figure 7.36) derived from the thresholded DoD for TS6 (D). The ECDs correspond to the three different CoD categories: habitat quality stable (beige in E), habitat quality improved (green in E), and habitat quality degraded (orange in E). Example from Mokelumne River, California. (Figure 7.37 from Wheaton (2008) ©)
Software Tools
A series of tools for performing the above analyses have been developed in Matlab and are available here. Additionally, a stand-alone Windows GUI and ArcGIS toolbar plugin are under development (Library in C++; plugin and GUI in C#). These software tools will be posted here for free download upon completion.
Case Studies
In Wheaton (
2008
), these techniques were tested at three case studies sites:
- Mokelumne River, California, US (Study Site Info)
- The River Feshie, Scotland (photo)
- Sulphur Creek, California, US
In addition the techniques are now being employed on the following Rivers/Streams:
- The Yuba River, California, US
- The Rees River, South Island, New Zealand
- Bear Creek, Middle-Fork Salmon River Headwaters, Idaho, US
- The Provo River, UT
- The Logan River, UT
- Asotin Creek, WA
- Bridge Creek, OR
- Salmon River, ID
- Salmon Falls, ID
- Green River, UT
- Yampa River, CO
- Colorado River, Grand Canyon, AZ
Future Work
In these studies, the estimation of surface representation uncertainty has been primarily derived from ground-based surveys (e.g. total station and RTK-GPS). Through ongoing research in this area we hope to extend these techniques to aerial surveys (e.g. LIDAR, Aerial photogrammetry) and we have already started extending this to ground-based LiDAR (a.k.a. terrestrial laser scanning). Regardless of the technique to quantify the spatially variable surface representation uncertainties in an individual surface, the methodology to propagate these uncertainties through to the DoD and explore their influence on morphometric sediment budget estimates will still apply.
In addition, the following areas will be pursued:
- using the tools on bigger, higher resolution data sets of different types over larger areas
- improving and extending the DoD Uncertainty Analysis (e.g. incorporation of roughness into fuzzy inference system)
- closing the sediment budget, by incorporation of flux terms (sediment transport)
- using the techniques to interrogate outputs from morphodynamic and LEM models
Collaborators
This work started in 2004 as a collaboration between Dr. James Brasington and myself. It evolved to become the focus of my PhD and has had significant contributions from my supervisors Dr. Steve Darby and Professor David Sear. In addition, Professor Greg Pasternack has been a collaborator on the Mokelumne River and Sulphur Creek case studies. Dr. Damia Vericat, Dr. Brasington and I are now using and extending the tools for analyses of terrestrial laser scan data on the Feshie and Rees Rivers (Vericat et al. 2007; Brasington et al. 2007). Dr. Igor Rychkov and I are now working on extending the Matlab software to an ArcGIS plugin and stand-alone application. The field work has been possible thanks to the hard labor of numerous individuals (see acknowledgements in Wheaton 2008), but among the most regular helpers are Dr. Rebecca Hodge, Clare Cox, and Richard Williams.
Relevant References:
Publications from this Research:
-
 Wheaton JM, Brasington J, Darby SE and Sear D. 2010. Accounting for Uncertainty in DEMs from Repeat Topographic Surveys: Improved Sediment Budgets. Earth Surface Processes and Landforms. 35 (2): 136-156. DOI: 10.1002/esp.1886.
 -
Wheaton JM, Brasington J, Darby SE, Merz JE, Pasternack GB, Sear DA and Vericat D. 2009. Linking Geomorphic Changes to Salmonid Habitat at a Scale Relevant to Fish. River Research and Applications. DOI: 10.1002/rra.1305.
- Wheaton JM. 2008. Uncertainty in Morphological Sediment Budgeting of Rivers. Unpublished PhD Thesis, University of Southampton, Southampton, 412 pp.
- Vericat, D, Brasington, J, Wheaton, JM and Cowie, M. 2008. Accuracy Assessment of Aerial Photographs Acquired using Lighter-Than-Air Blimps: Low-Cost Tools for Monitoring Fluvial Systems. River Research and Applications. DOI: 10.1002/rra.1198.
Presentations of this Research:
- Presentation: Wheaton JM, Brasington J, Darby SE, Sear D and Vericat D. 2008. Beyond the gross reach-scale sediment budget – using repeat topographic surveys for mechanistic geomorphic interpretation, British Society for Geomorphology Annual Meeting, Exeter, UK.
- Talk: Wheaton, JM, Vericat D, Brasington J, Darby S, Sear D, Pasternack GB. 2008. Linking Morphological Sediment Budgeting to Salmonid Ecohydraulics, BHS Meeting: Ecohydraulics at Scales Relevant to Organisms, Loughborough.
- Poster: Wheaton JM. 2008. Do Geomorphic Dynamics Matter to Fish?, MYRES 2008: Dynamic Interactions of Life and its Landscape. New Orleans.
- Invited Presentation: Brasington J, Vericat D, Wheaton JM and Hodge R. 2008. Reach-scale retrieval of alluvial bed roughness, Geophysical Research Abstracts: EGU General Assembly. European Geophysical Union: Vienna, Austria, pp. EGU2008-A-01295. (See here for details on Remote Sensing of Rivers Session).
- Wheaton JM et al. 2007. Improved Fluvial Geomorphic Interpretation from DEM Differencing. Eos Trans. AGU. 88(52): Fall Meet. Suppl., Abstract H43E-1672.
- Vericat D, Brasington J, Wheaton JM and Hodge R. 2007. Reach-Scale Retrieval of Alluvial Bed Roughness. Eos Trans. AGU. 88(52): Fall Meet. Suppl., Abstract H51E-0799.
- Brasington J, Wheaton JM, Vericat D and Hodge R. 2007. Modelling Braided River Morphodynamics With Terrestrial Laser Scanning. Eos Trans. AGU. 88(52): Fall Meet. Suppl., Abstract H51L-02.
- Brasington J, Wheaton JM and Williams RD. 2004. Sub-Reach Scale Morphological Interpretations from DEM Differencing: Accounting for DEM Uncertainty. Eos Trans. AGU. 85(47): Fall Meeting Supplement, Abstract H43A-0352.
- Wheaton JM, Brasington J and Williams RD. 2004. Modelling Fluvial Sediment Budgets Under Uncertainty. Eos Trans. AGU. 85(47): Fall Meeting Supplement, Abstract H53C-1264.
Cited Papers:
- Brasington, J., Langham, J. and Rumsby, B., 2003. Methodological sensitivity of morphometric estimates of coarse fluvial sediment transport. Geomorphology, 53(3-4): 299-316.
- Church, M., Ham, D. and Weatherly, H., 2001. Gravel Management in the Lower Fraser River, Department of Geography, The University of British Columbia, Vancourver, British Columbia.
- Fuller, I.C., Large, A.R.G., Charlton, M.E., Heritage, G.L. and Milan, D.J., 2003. Reach-Scale Sediment Transfers: An Evaluation of Two Morphological Budgeting Approaches. Earth Surface Processes and Landforms, 28: 889-903.
- Gaeuman, D.A., Schmidt, J.C. and Wilcock, P.R., 2003. Evaluation of in-channel gravel storage with morphology-based gravel budgets developed from planimetric data. Journal of Geophysical Research- Earth Surface, 108: 1-16.
- Lane, S.N., Westaway, R.M. and Hicks, D.M., 2003. Estimation of erosion and deposition volumes in a large, gravel-bed, braided river using synoptic remote sensing. Earth Surface Processes and Landforms, 28(3): 249-271.
- Merz, J.E., Pasternack, G.B. and Wheaton, J.M., 2006. Sediment budget for salmonid spawning habitat rehabilitation in a regulated river. Geomorphology. 76(1-2): 207-228
- Milne, J.A. and Sear, D., 1997. Modelling river channel topography using GIS. International Journal of Geographical Information Science, 11(5): 499-519.
- Wechsler, S.P., 2003. Perceptions of Digital Elevation Model Uncertainty by DEM Users. URISA Journal, 15(2): 57-64.
- Wechsler, S.P., 2000. Effect of DEM Uncertainty on Topographic Parameters, DEM Scale and Terrain Evaluation, State University of New York, Syracuse, New York, 380 pp.
Subpages (2): Green LiDaR DoD Uncertainty Project PhD Thesis
