gis
Overview
In this task we are provided with some raw topographic survey data. Your job is to build a DEM from that data (of appropriate resolution), show the water depth overlaid on the DEM, and pull a longitudinal profile and some cross sections off the DEM. You will use a triangular irregular network (TIN) to interpolate between your raw topographic survey data and produce a continuous surface that you will later convert to a raster DEM.
These instructions are for ArcGIS 10 and are primarily provided in the form of video tutorials. As an additional reference, you might find the ‘Using ArcGIS 9.3.X to Construct and Manipulate DEMs’ tutorial listed in the main Lab 6 page helpful (it uses different data, and is for the old version of ArcGIS, but goes through a similar sequence of steps to arrive at the same end point in Part I of the document; one significant difference is the absence of TIN editing in ArcGIS 9.3.X).
Data
Everything you need to create a TIN can be found in the PatsCabinSurveyPoints.csv* *file and the Task3_PatsCabinShapefiles.zip![]() . This video tutorial goes through what is included in the data and how to import it into ArcGIS:
. This video tutorial goes through what is included in the data and how to import it into ArcGIS:
Although not covered in the video tutorial, I would suggest exporting the PatsCabinSurveyPoints.csv* *table you imported as X-Y points to a shapefile or feature class to use in the construction of the TIN (I named mine TopoSurveyPoints).
Building TINS
Your First TIN
In this video tutorial, we go through the simplest form of constructing a TIN from just raw topographic survey point data. We also highlight some of the potential pitfalls to this approach.
A Better TIN
In this video tutorial, we talk about how you can build a TIN using a polygon hardclip boundary as well as how to manually edit your tin with the TIN Editing Tools.
A Better TIN yet
In this video tutorial, we will use the same data used in our first two TINs as well as the some 3D breakline data provided to you:
Building DEM
Building the DEM is a simple matter of converting the TIN to a Raster. This video tutorial walks you through the considerations.
For this exercise, you need to tell your boss what is an ‘appropriate’ resolution at which to model this DEM. Thus, you should produce rasters over a range of resolutions. You could do this manually by running the TIN to Raster tool multiple times. Or you could employ Batch Processing.
Batch Processing
Batch Processing makes it possible to run this tool (or any other) over and over without your intervention.
Right click on the TIN to Raster tool in the 3D Analyst (Conversion > From TIN) toolbox > choose Batch.
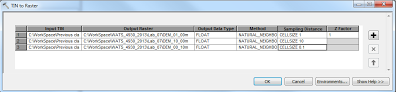
Double clicking in the Input TIN and Output Raster boxes will open new windows that will allow you to browse to your desired input TIN and destination folder. Name the DEM with name that reflects the resolution (for example, I called mine DEM_01_00 for the 1 meter DEM, DEM_10_00 for the 10 meter, DEM_00_10 for the 10 centimeter, etc.).
In the Output Data Type, Method, and Sampling Distance boxes, clicking in the window will display a drop down arrow allowing you to choose the correct inputs. Use the “Add Row” button on the right to add a row for each resolution or DEM output you want to create. Copy and paste the full paths of the Input TIN and Output Raster files and set the correct inputs for each row.
Click OK to initiate batch processing of your various DEM resolution output files.
Building Water Depth DEM
Since we have a DEM that includes shots above the water and below the water, and because the survey data denotes where the water’s edge shots are, we can derive a bathymetric water depth DEM. The steps are:
- Build a water surface TIN from the water edge data
- Convert that water surface TIN into a DEM of the same resolution and extent (i.e. concurrent) as our original DEM
- Use Raster Calculator to derive water depths by subtracting the lower elevation DEM from the higher elevation water surface.
The resulting water depth map can be overlaid on the DEM to provide a more intuitive context of the physical habitat within the reach as the pools, bars, and beaver ponds jump out more clearly than from the topography alone. This video walks you through the sequence:
Pulling Some Cross Sections and a Long Profile Off DEM
Using the 3D Analyst interpolate line and profile graph features, you can easily pull off a longitudinal profile and cross section(s) from the DEM. This video shows you how:
What to turn in
See the what to turn in section of the main lab page for what is expected from Task 1.