gis
Introduction to Lab
Overview
During this lab you will work on building, displaying and manipulating digital elevation models (DEMs). This lab will be one of the more involved lab this semester (excluding your project). The skills you develop are fundamental to any types of raster analysis you may later undertake.
Two of the biggest challenges when working with DEMs are a) getting data from whatever format it is provided in and translating it into a format you can work with and b) getting it to work and look how you want. This workshop will give you experience acquiring raster data of different types, building DEMs, and presenting them in useful maps.
Prerequisites
The only prerequisite for this lab is a basic proficiency in using ArcGIS 10 (e.g. Lab 1 and Getting Oriented). It is also expected that you are familiar with the 6 C’s to make effective maps.
Lab Objectives
This lab is intended to make you proficient in the use and manipulation of DEMs. The lab not only gives you experience working with DEMs, but many of the skills you develop here are more generally applicable to dealing with raster datasets in general. By the end of the lab, you will:
- Have acquired and worked with DEMs in common formats and from typical data sources
- Built an appreciation of the tradeoffs between DEMs at different resolutions and built from different data sources using different methods
Meets Course Learning Outcomes 2, 3 & 5.
Instructions & Lab Tasks
As with all labs… This is a fictitious scenario!
For the next week you work for an environmental consulting firm (Big Cheese Watershed Management) which specializes in watershed management. Right before your boss left for a vacation, he spent five minutes leaving you with some vague and hasty instructions to prepare a bunch of DEMs for a new project the firm just acquired. He wants you to put together your figures and findings on a couple of project pages (your lab pages). The pages will be used to illustrate for the client the variety of DEM data available for their project and to help them understand the differences between the data types. Oh yeah, and the Big Cheese himself wants it done by the time he gets back (with a tan) in a week! Nice guy, eh?
His vague instructions and context can be summarized as follows:
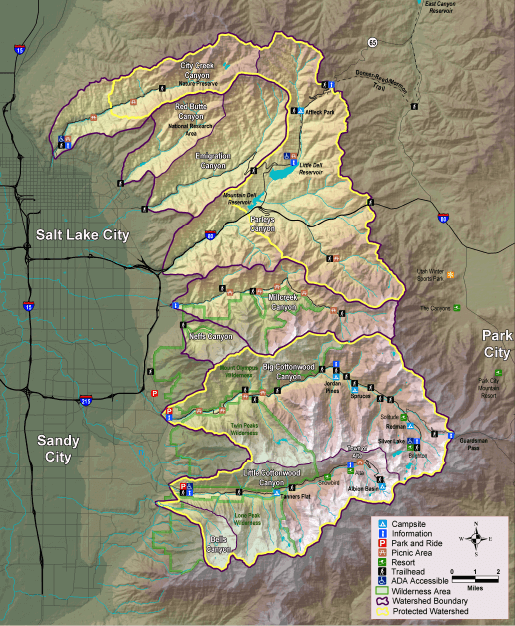
Big Cottonwood Canyon Watershed Group
“So we just got hired by the Cottonwood Canyons Foundation to help them with public outreach and prioritizing stewardship activities in Big Cottonwood Canyon watershed. I think what we need to do is pull together all the DEM data we can get our hands on for the Canyon. That includes the NED 30 m and 10 m junk, as well as that 2 m LiDaR and 5 m dataset that the Utah GIS portal folks have. We need to create some nice visuals using those different datasets. Then we need to highlight the differences between those available data-sets in terms of what sort of topography is resolved between them. This will be critical information as we move forward helping them use those datasets to prioritize stewardship activities.”
Task 1: Show All the DEMs
“Make maps of the Big Cottonwood Watershed using each of the four DEM data sets available and make a compelling argument for which dataset is the best choice for them.”
Task 2: Highlight Differences Between the DEMs
“Highlight how the four DEMs differ in terms of the topographic features they can resolve based on their raster resolution and 40 ft contour intervals derived from each. Speculate what the pros and cons of each might be for use in the later stewardship prioritization work we may do for them.”
Big Cottonwood Canyon Watershed
Detailed Instructions: Translation of Your Boss’s Vague Instructions
Detailed Instructions
Data for This Lab
While DEM data exists for your area of interest, it is often a challenge to get it in the format you want, covering the extent you are interested in. Since DEMs are rasters, they are typically available in rectangular raster tiles. Almost always, the area you are interested in is on the junction of, or covers, multiple raster tiles. Tasks 1 and 2 are all about working with existing DEM data provided from somewhere else.
The download of data you need for Task 1 and Task 2 is described in the Task 1 Instructions.
What to Submit
-
Spatial Context: locator map showing watershed and extent indicator for larger scale maps. This can be done with an interactive google map or a static map figure.
-
Task 1:
-
-
Create a set of figures that *clearly illustrate the resolution differences* between the 4 datasets at fine scale (i.e. smaller extent).
-
- Clearly label each map with the resolution and DEM type (i.e. lidar, autocorrelated, NED, etc.)
- Zoom in enough to show a feature on the surface
- Maps must be the same scale and extent.
- Show a 3D perspective (ArcScene) of one of these Big Cottonwood Canyon DEMs. (optional)
-
-
Task 2:
-
-
Show a figure demonstrating the 4 peaks from which you extracted elevations.
-
In your write up provide:
-
- The elevations of the peaks as derived from the 4 DEMs,
- an explanation of why the elevations are or are not the same,
- an explanation of the peak “movement”, and
- which elevation is the closest to the truth and why.
-
Make sure your lab conforms to the general lab submission guidelines. Submit a URL for this lab’s webpage.
Additional Resources
Lab Introduction Slides
![]() Lab 6 Slides - Shannon Belmont Spring 2013
Lab 6 Slides - Shannon Belmont Spring 2013
Where to get DEM Data:
- USGS National Map - *Download various elevation datasets 10 m, 30 m and 90m for entire country *
- USDA’s Geospatial Data Gateway - You can also download 10 m and 30 m DEMs from here (much easier to use then National Map Seamless Server)
- Open Topography Portal - This is primarily just high resolution LiDaR data, but very useful if it happens to fall within your study area.
- Utah GIS Portal Elevation Datasets - In Utah, we have access to a lot of great DEM datasets that other states do not!
Follow up Activities:
- Introduction to 3D Analyst Tutorials
- 3D Visualization Techniques Using ArcGIS 10 - This one isn’t free.
- Using ArcGIS 9.3.X to Construct and Manipulate DEMS -
 Tutorial ;
 Data (Part of ICRRR Part II Short Course) - I prepared this for ArcGIS 9.3x and it is very similar to Task 3.
ArcGIS 10 References
- Fundamentals of Surfaces- ESRI Help Document
- Building a TIN to represent a Terrain - ESRI Help Tutorial
- Creating and Using a Terrain Dataset - ESRI Help Tutorial