gis
Background on the Fuzzy Black Box
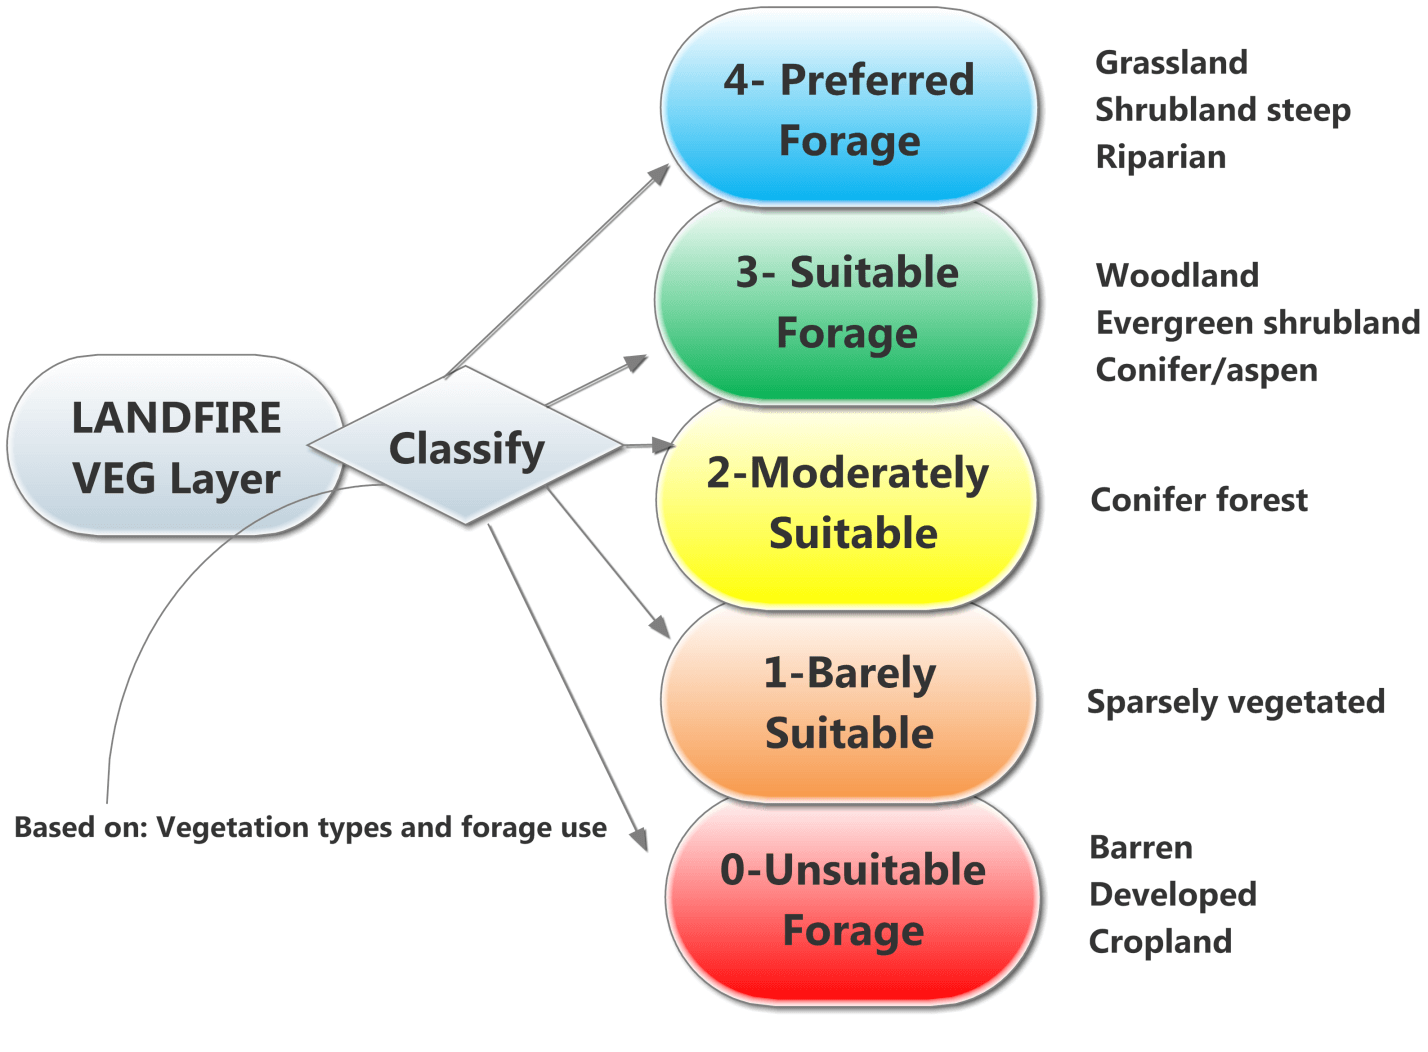
Heavy ungulate browsing in riparian areas can reduce the distribution and abundance of woody riparian species, especially cottonwood and willow, because they are highly preferred browse (MacFarlane & Wheaton 2013). The model is driven by LANDFIRE vegetation data, which we classify by its suitability as forage for cattle in this case. Below is an example where the LANDFIRE vegetation cover data (1) was classified for its suitability for beaver (2).

Numerous other researchers have highlighted the importance of the composition of plant communities for ungulates (Senft et al., 1985). Here, we use a look up table based on the associations below:
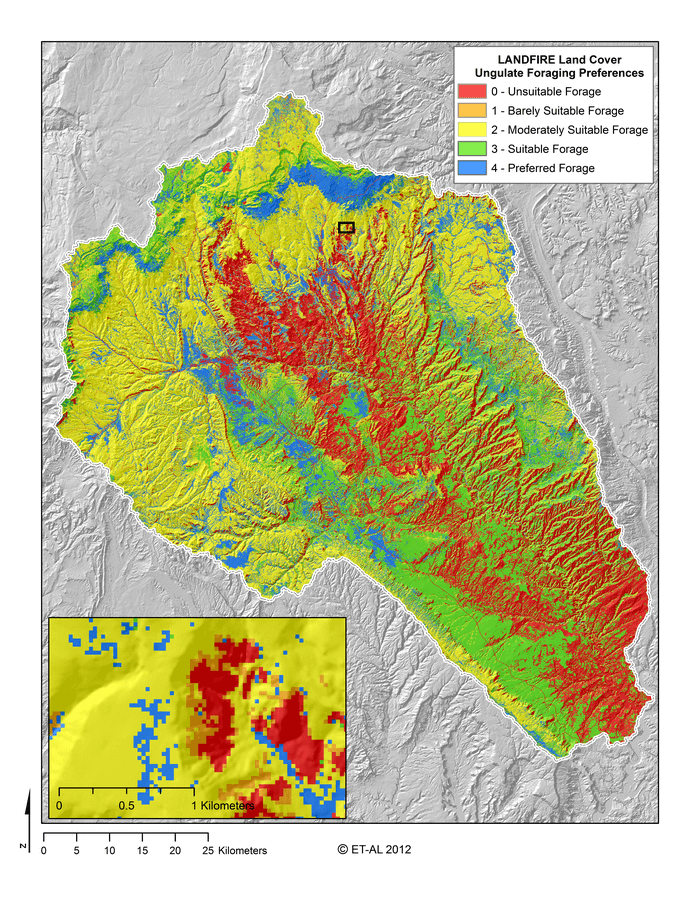
When the classification is applied, we get something like this:
Similarly, distance to a reliable water source (Holechek, 1988) and slope (Ganskopp and Vavra, 1987) have been highlighted as key factors influencing where ungulates are likely to congregate. We derived slope (as a percent) from a 30 m USGS DEM and we derived distance from water (in meters) using a simple Euclidian distance geoprocessing algorithm with perennial streams, springs and water bodies as inputs (see Inputs for examples).
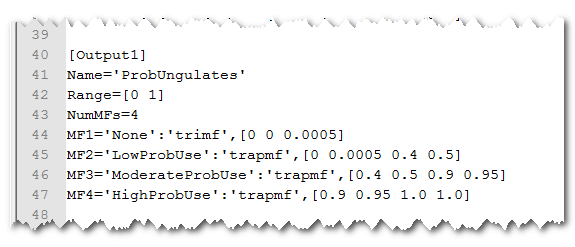
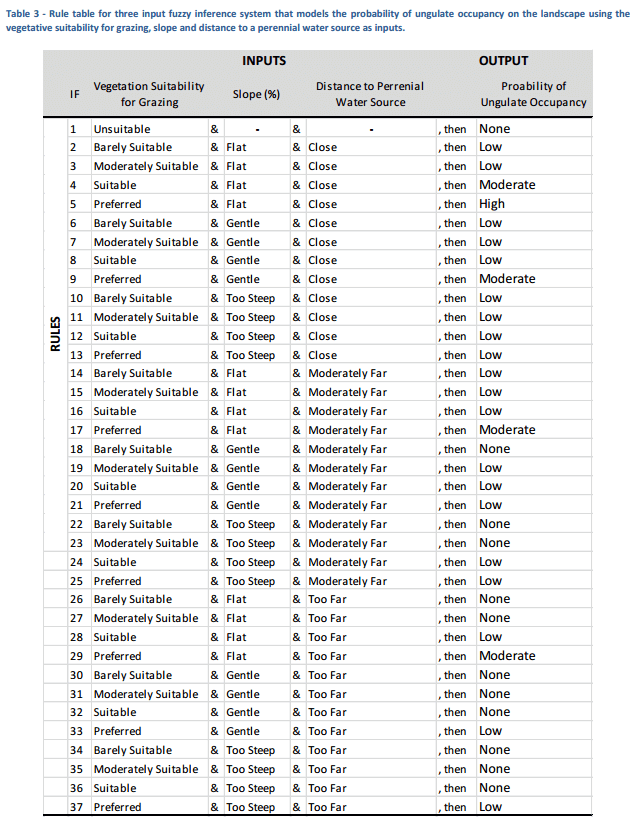
The above inputs are combined into a fuzzy inference system (Jang and Gulley, 2009) using the Matlab fuzzy logic toolbox. We used concurrent 30 m rasters of classified vegetation, distance to water and slope to estimate the probability of ungulate occupancy in a given 30 m pixel based on the rules outlined in the table below. Membership functions were calibrated for slope and Euclidian distance based off of values reported in the literature. The inference system is a simple text file (GrazingProb_FIS.fis) you can view in a text editor (e.g. Notepad++).

To do this, we use a fuzzy inference system that allows us to develop a linguistic expert-based rule system (Table 1), but relies on continuous numeric input variables and a continuous output (Adriaenssens et al., 2003; Klir and Yuan, 1995). The Fuzzy Logic Toolbox 2.0 in Matlab was used to run the model (Jang and Gulley, 2009). The rule table developed is shown in Table 1 and the specification of membership functions for the linguistic categories for inputs and the output is show in Figure 11. Note that the input membership functions are centered on the categorical values (1, 2, 3 and 4) used in vegetation classification of the figure above.
By contrast, the outuput membership function is simply described in terms of probabilities (e.g. none, low, moderate, and high):
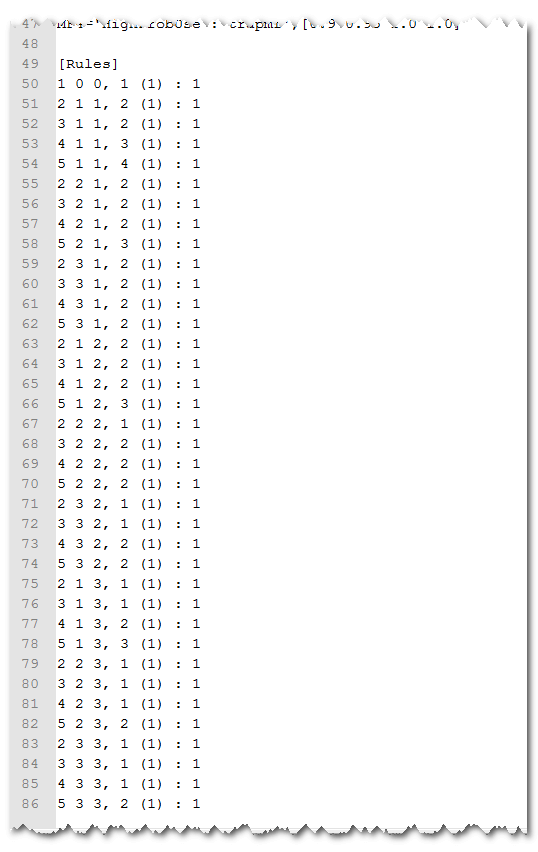
The rules in the input file have numbers that refer to the membership functions. For example, 3 1 1, 2 (1) : 1 can be read by looking at membership function 3 for input 1, membership function 1 for input 2, and membership function 2 for input 3, which will produce an output equivalent to membership function 2 (the (1) : 1 just means this rule is equally weighted to the others. More simply, the rule 3 1 1 , 2 read’s If vegetation suitability for grazing is ‘moderately suitable’, and slope is ‘flat’ and distance to perennial water source is ‘close’, then the probability of ungulate capacity is ‘low’.
So the above FIS text can be translated to words and a more readable table as shown below:
It is important to understand that since the inputs are crisp, they frequently have ‘overlapping’ membership in two categories. What this means is that for any given input, multiple rules may apply. The fuzzy inference system combines or aggregates these rules together to calculate the total consequence of any input.
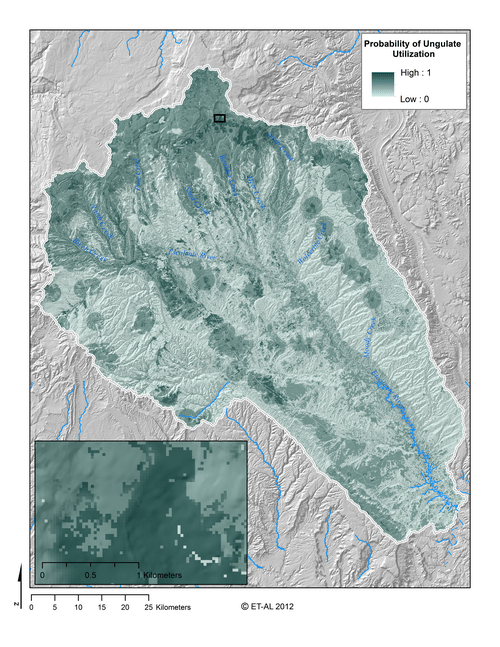
This model is applied on each raster cell and the output is an aggregated membership function that represents the full range of uncertainty in predicting the ‘occcupancy’ in a cell. That output membership function is defuzzified using its centroid, so that a crisp output (as a single probability) can be reported and used for symbolizing the raster. The model produces an output as illustrate below:
References
- Adriaenssens, V., Baets, B.D., Goethals, P.L.M. and Pauw, N.D., 2003. Fuzzy rule-based models for decision support in ecosystem management. Science of the Total Environment, 319(1-3): 1-12
- Jang, J.S.R. and Gulley, N., 2009. Fuzzy Logic Toolbox 2: User Guide, Matlab, Matlab, Natick, MA.
- MacFarlane WW and Wheaton JM. 2013. Modeling the Capacity of Riverscapes to Support Dam-Building Beaver - Case Study: Escalante River Watershed, Final Report Prepared for Grand Canyon Trust and the Walton Family Foundation, Logan, UT, 79 pp.
- Senft, R.L., Rittenhouse, L.R. and Woodmanse, R.G., 1985. Factors influencing patterns of cattle grazing behavior on shortgrass steppe. Journal of Range Management, 38(1985): 82-87.