gis
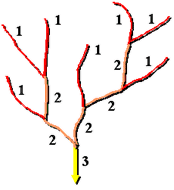
Your boss has also asked you to define the drainage network and determine the Strahler (1952) Stream Order of the entire Big Cottonwood Creek drainage network. Follow the steps below.
Flow Accumulation
If you have not already run the Flow Accumulation tool for the 10m DEM for Task 1, do so now (see here for instructions). You will use the symbology classification tools for the flow accumulation raster to experiment and determine what cell value classification best represents an appropriate stream network for the basin. You will use this threshold to run a raster calculation which creates a new output raster that includes this subset of flow accumulation or stream network cells to use in the stream order tool.
But first, what do the cell values in a flow accumulation grid represent? If a flow accumulation raster cell has a value of 12 or 1200, what does that mean? The cell value equals the number of grid cells upstream that drain to that cell (based on the pit-filled DEM and assumption that water flows down the path of steepest descent). This is obviously a grid-resolution dependent function. In order to use the flow accumulation to display something that represents a realistic stream network, how many values are enough to mean you have a stream versus not having a stream? In other words, what flow accumulation value represents the point at which streams are initiated? Is there such a value? What landscape characteristics and processes might affect what that number is (if there were such a threshold number)? Not just a little thought experiment for you to ponder in your spare time… you’ll do this below. They might also make for an interesting discussion in your write-up.
Stream Order
Define the Strahler Stream order for your drainage network from Flow Accumulation (see link below). Essentially, this involves defining some threshold for flow accumulation (using the layer’s symbology) and using the Raster Calculator to create a new raster comprising only the cells you have chosen to represent the stream network . You can use the SGID93_WATER_StreamsNHDHighRes shapefile you downloaded for Lab 5 as a guide, although it has a lot of stream detail you may not want to include. Or you can use the blue-lined defined streams on the topography basemap from ESRI (as in the video tutorial below). You will need to experiment with different thresholds to arrive upon an acceptable value.
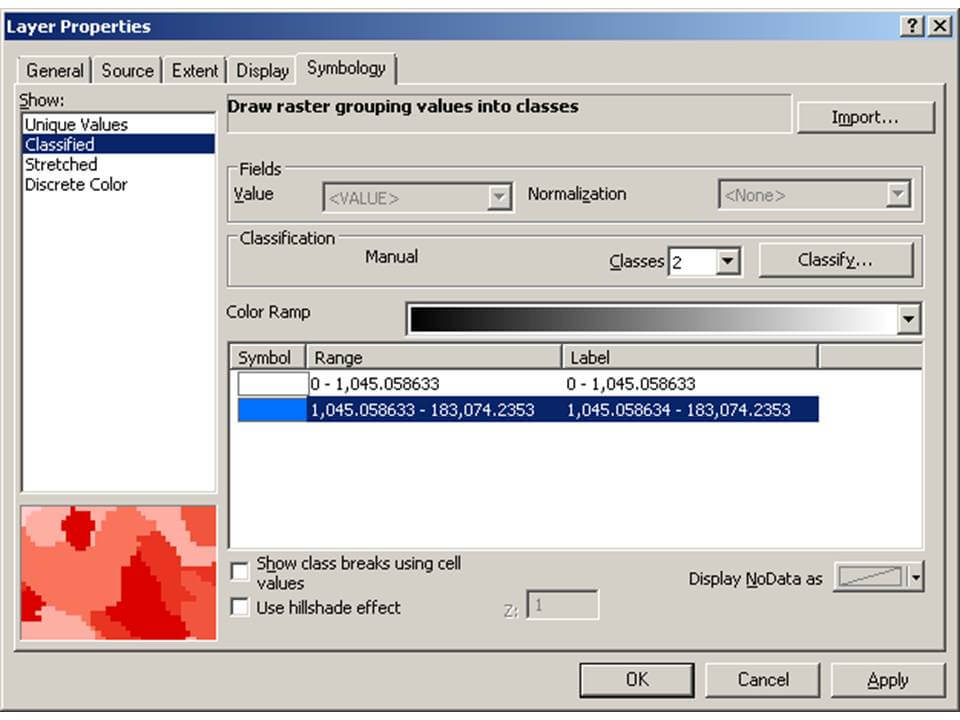
This is the layer properties dialog box for the Flow Accumulation raster. As shown in the video tutorial below, you can play with the classification settings to figure out what an appropriate threshold will be:
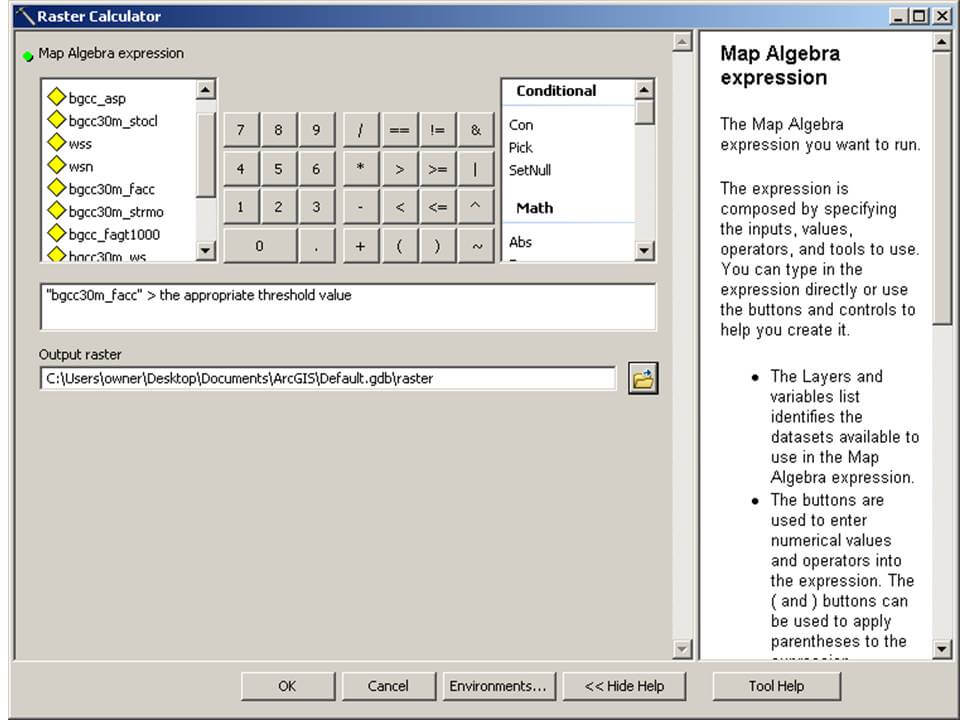
When you have determined an appropriate threshold value for displaying the stream channel, open the Raster Calculator tool in the Spatial Analyst toolbox and write an expression that selects values above your threshold for output into a new raster.
- It might be helpful to change the color of the 0 cells (those cells that failed the test) to null and the color of the channels (cell value = 1; those areas that passed the test) to blue.
- It might be helpful to name this Calculation something meaningful (e.g. thresholded channel network).
- You can reclassify the raster to get the false values (0) to no data values.
Now you have a raster you can use to define stream order. You can do this using the stream order tool in the Spatial Analyst -> Hydrology toolbox.
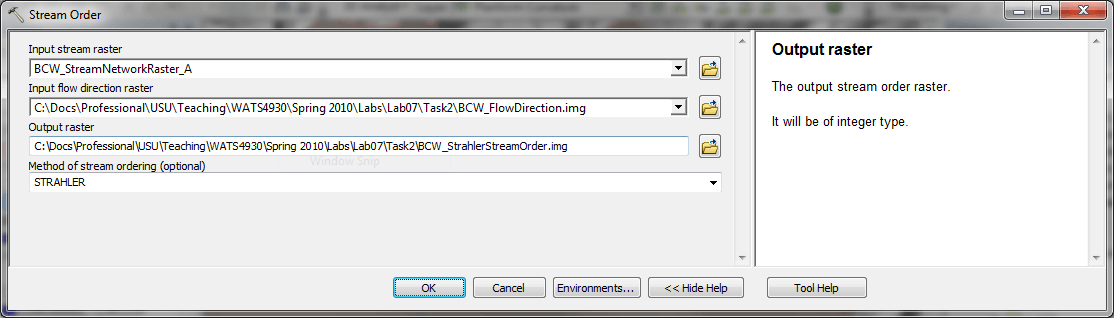
Input the raster that resulted from your raster calculation, and your flow direction raster, and specify the output raster to a name and location that you will recognize and can find. When finished, you may find it easiest to convert this raster output to a vector output (i.e. Raster to Polyline tool), so you can then calculate the stream lengths easily of all the first, second, third and/or fourth order streams. Make sure you check the values of the output analysis to see that they are correctly ordered (if not, you may need to rerun the analysis or reclassify them).
For Task 2 you should present the results of your stream order analysis as they relate to some existing mapping of streams in the Canyon. Include the flow accumulation threshold value you chose to define the stream network. Remember, your boss only wants the drainage network and stream order for the Big Cottonwood Creek watershed. (Hint – a clip or mask data or display may be involved.)
See What to Submit section on main Lab 8 page and Lab 8 Rubric (Canvas) for details.
References
- Strahler AN. 1952. Dynamic basis of geomorphology. Geological Society of America Bulletin. 63: 923-938.