gis
Introduction to Lab
Background
You have used DEMs effectively to make persuasive maps (Lab 02), and now have built DEMs from raw data (Lab 07). At the heart of GIS raster analysis is the ability to analyze surfaces or landscapes to generate interesting and useful information from the elevation data in a DEM. In this lab, we use the Salt Lake County USGS NED 10m DEM from Lab 06 to delineate the watershed for Big Cottonwood Creek and to perform a series of morphometric analyses to better understand the physical characteristics of the watershed.
All the data you need for this lab was produced or provided in Lab 06.
Prerequisites
Lab Objectives
The primary purpose of this lab is to show you how to do more with DEMs than just make pretty maps. Upon completion of the workshop exercise, you will have:
- Delineated a watershed from a DEM
- Derived a drainage network
- Appled some common morphometric analyses to DEMs
Meets Course Learning Outcomes 2 & 4.
Slope Analysis
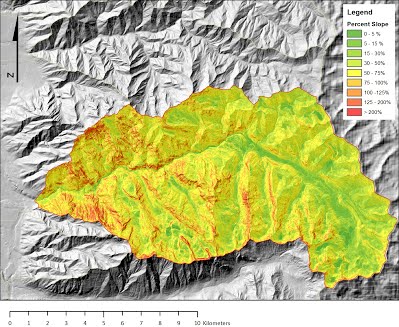
Slope Analysis of 10 m USGS DEM for Big Cottonwood Canyon
Lab Tasks
This week, you are still working for the same old ‘Big Cheese’ environmental consulting firm who specializes in watershed management (congratulations, you were not fired last week). Your boss has reviewed the work you did comparing and analyzing resolution differences for DEMs in Big Cottonwood Canyon and has come back with some further instructions.
For this assignment, you should work with the 10 m DEM you used in Lab 6 - Task 1.
He would like you to:
-
- Delineate the watershed for Big Cottonwood Creek
- Create figure demonstrating difference between delineated and existing BCC watershed
-
- Perform a Strahler stream order classification of the entire Big Cottonwood Creek watershed
- Create figure demonstrating difference between existing stream map
-
- Calculate slope, plan-form curvature, and profile curvature for the watershed
- Create Table reporting Mean and STD, minimum, and maximum slope, profile and planform curvature for watershed
Extra Credit (20 pts)
You may repeat these analyses on a higher resolution DEM from Task 1 of Lab 6 to see to what extent the results change (5m autocorrelated DEM or 2m LiDAR for whole watershed). Evaluate and discuss the potential benefits and detriments of using a higher resolution DEM to perform these analyses. Compare flow accumulation channel networks, min max mean slopes for watershed, and total watershed size.
Lab Instructions
- Getting Started & Tips
- Task 1 - Watershed Delineation
- Task 2 - Drainage Network Definition
- Task 3 - Morphometric Analyses
What to Submit
Task 1- Watershed Delineation
- Create a figure showing a difference between your delineated watershed and the shapefile acquired from the UT AGRC.
- Select a basemap, layers, and scales/extent that help convince your boss that the delineation is accurate
Task 2 - Strahler Stream Order
-
Create a figure displaying the Strahler stream order classification for the Big Cottonwood Creek watershed
-
- Use effective symbology
- Provide the flow accumulation threshold value used to define stream channels
- Include a figure that demonstrates locations where your delineation both aligned with and differed from from streams mapped on a basemap image from ESRI or a stream file downloaded from the AGRC.
- Report the total stream length (in kilometers) for each stream order
Task 3 -
-
Provide 3 captioned figures (at appropriate resolution to show detail) displaying raster results of slope, planform curvature, and profile curvature analyses for the Big Cottonwood Creek watershed
-
Provide table summarizing minimum, maximum, mean, and standard deviation statistics for 3 watershed characteristics (slope, planform curvature, and profile curvature) for Big Cottonwood Creek watershed on your webpage
- Slope
- Profile curvature
- Planform curvature
Make sure your lab conforms to the general lab submission guidelines. Submit a URL for this lab’s webpage.
Additional Resources:
Lab Introduction Lecture Slides
![]() Lab 8 Slides - Shannon Wing Belmont Spring 2014
Lab 8 Slides - Shannon Wing Belmont Spring 2014
Other Tutorials
- Sky Coole’s GIS 4 Geomorphology provides an excellent set of tutorials on how do everything from calculating minimum eroded volumes, to deriving hypsometric curves, to delineating terraces.
