ELR/BPA - ISEMP Lemhi Topographic Survey Technique Intercomparison

Project Type: Sponsored Research Project Sponsor: Eco Logical Research, Inc. Project Location: Lemhi River Intensively Monitored Watershed, Lemhi River Basin, Idaho Status: Completed
Project Overview
Purpose of Project
To quantify the relative accuracy and precision of different ground-based (TS, rtkGPS, TLS) and airborne (ALS) topographic survey techniques at characterizing wadeable streambed and bare earth floodplain topography across six sites that represent a diversity of planform, width, gradient and riparian vegetation types.
Abstract:
Fine-scale resolution digital elevation models (DEMs) created from high precision instruments (e.g. total station, rtkGPS, and laser scanning) have become ubiquitous in the field of fluvial geomorphology. They permit a diverse range of spatially explicit analyses including hydraulic modeling, habitat modeling and geomorphic change detection. While previous studies have assessed the quality of topographic surveys at individual sites or across a limited number of sites, the intercomparison of survey technologies across a diverse range of wadeable stream habitats has not yet been examined. Researchers are increasingly looking for guidance and rules of thumb as to what techniques are feasible and will best suit their individual needs for their particular studies. In this study, we seek to provide such guidance. We quantified both the relative quality and the amount of effort spent collecting data to derive bare earth topography from an array of ground-based and airborne survey techniques. We used topographic survey data collected over the summer of 2010 from six sample reaches of varying complexity in the Lemhi River Basin, Idaho, USA. Complete, separate surveys were attempted at each site using total station (TS), real-time kinematic (rtk) GPS, discrete return terrestrial laser scanner (TLS), and airborne infrared multi-return laser scanning (ALS). The precision and accuracy of derived bare earth DEMs was evaluated relative to the higher precision total station point data. Significant DEM discrepancies between pairwise techniques were calculated using propagated DEM errors thresholded at a 95% confidence interval. Mean discrepancies between total station and rtkGPS DEMs were relatively low (≤0.05 m), yet TS data collection time was up to 2.4 times longer than rtkGPS. ALS DEMs had lower accuracy than TS or rtkGPS DEMs, but the aerial coverage and floodplain context of the ALS dataset was superior all other techniques. The TLS bare earth DEM accuracy and precision were lower than any other technique as a result of vegetation returns misinterpreted as ground returns. This was most likely an artifact of a low angle of incidence, scanner range and our method of cleaning the raw scan data.
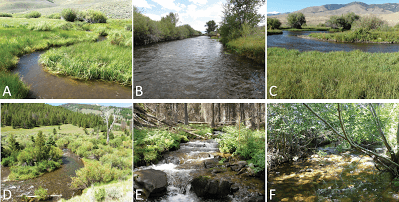
Figure 1. Site photos: Big Bear Creek (A), Lemhi River - straight (B), Lemhi River - anastomosing (C), Bear Valley Creek (D), Wright Creek (E), and Big Timber Creek (F).
Significance of Project:
- The results of this study are helpful for understanding the strengths and weaknesses of available high precision surveying techniques across the diversity of stream types present in most catchment.
- The results indicate that a hybrid of data acquisition methods (e.g. TS in-channel and ALS on the floodplain) can be used to build a more complete representation of channel topography.
Methods
Field Methods:
- TS
- rtkGPS
- TLS (e.g. ground-based LiDaR)
- near infrared ALS (e.g. airborne LiDaR)
NOTE: No rtkGPS surveys at 2 sites (Wright, Big Timber) due to dense vegetation and lack of rtk signal
Analysis Methods:
- Residual = ZDEM - ZTS POINT
- ME
-
σ
- TS, rtkGPS, and ALS - fuzzy inference system (FIS) model
-
TLS - detrended σ of the point cloud
- DEM of Difference (DoD) = DEM A - DEM B
- DoDs were thresholded at a 95% CI to constrain significant differences between two techniques (i.e. a signal) from DEM noise
- Results
Residual Analysis & DEM Accuracy:
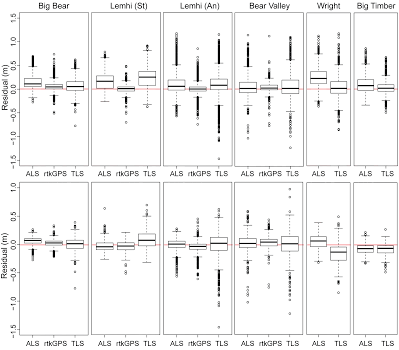
- rtkGPS DEMs were most precise (σ = 0.10 m)
- At the scale of the entire site, there was appreciable bias in the ALS and TLS DEMs to being positively skewd (i.e. overestimating elevation) due to the signal being attenuated in water and vegetation returns that were misclassified/misinterpreted as ground returns
- Bias in ALS and TLS DEMs was drastically reduced when analysis was limited to non-wetted areas
Figure 2. Boxplot of residuals (i.e. ZDEM - ZTS) across the entire sample site (top) and across the non-wetted are of the sample site. Boxplots represent interquartile range (IQR; bottom quartile (25%), median and upper quartile (75%)), whiskers are at a maximum of 1.5 IQR, and circles represent outliers greater than 1.5 IQR. Figure from Bangen (2012).
Spatially Variable DEM Elevation Uncertainty (δ):
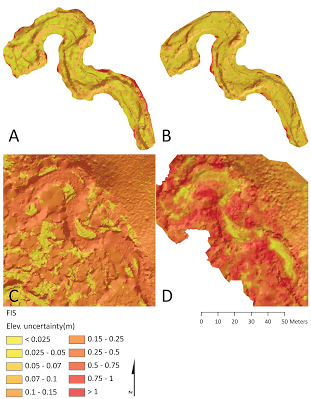
- TS and rtkGPS DEMs δ was lowest for cells that fell in areas with low relief (e.g. bars, low gradient riffles, bank tops), where point density was high, and/or breaklines were in close proximity. Conversely, δ was highest for cells that were long high gradient streambanks, where point density was lower, and/or distance to breaklines was greater.
- **ALS **DEM δ was lowest for cells that fell in areas with limited vegetation (e.g. exposed bars, low vegetated floodplains) and/or where point density was high. DEM δ was highest in the wetted channel.
- **TLS **DEM δ was lowest for cells that fell along exposed bars and shallow riffles, and was highest in areas with dense willows and conifers.
Figure 3. Example of estimated DEM elevation uncertainties compared for TS (A), rtkGPS (B), ALS (C), and TLS (D) at Bear Valley Creek Site. A-C were derived using separate Fuzzy Inference System (FIS) models, and D is a roughness model derived from the detrended standard deviation of the point cloud. Figure from Bangen (2012).
Pairwise DEM Comparisons:
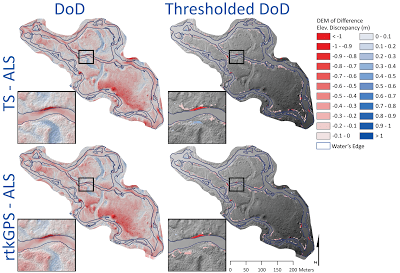
- TS - rtkGPS DoDs indicated reach-wide, low magnitude elevation discrepancies between the two techniques. Larger discrepancies were centered along the channel margins (which is typically more difficult to accurately capture in topographic surveys), in pools (based on how these features were selectively sampled), and in areas with overhanging vegetation (no TS coverage due to lack of clear line of site and/or no rtkGPS coverage due to lack of satellite reception). When thresholded the majority of these discrepancies were not significant, and those that were tended to be outside of the wetted channel.
- TS - ALS and rtkGPS - ALS larger magnitude elevation discrepancies occurred within the wetted channel (due to the infrared ALS signal being attenuated in water) and in highly localized areas on the floodplain where ALS vegetation returns were misclassified as ground returns. As the ALS survey had a much higher point density than the TS or rtkGPS surveys, the majority of out of channel elevation discrepancies represent that the resulting ALS DEM more accurately repsented floodplain topography and was able to capture subtle features, such as paleo-channels.
- TLS - ALS DEM Z discpreancies increased with greater distance from TLS scan station locations. We inferred this was primarily due to the angle of incidence of the emitted TLS pulse becoming lower with increased distance from the scanner location increasing the probability of returns from vegetation and not the ground
Figure 4. Example results of unthresholded (i.e. straight) DEMs of Difference (DoDs) on the left and DoDs calculated using propagated FIS DEM elevation uncertainty estimates thresholded at a 95% CI on the right at the Lemhi River anastomosing site. Areas colored gray in the thresholded DoD represent areas where observed discrepancies were not significant at the 95% CI. Figure from Bangen (2012).
Results Synthesis:
-
TS and rtkGPS DEMs were relatively accurate and precise, but we:
-
- a) encountered significant survey challenges in areas with dense vegetation that resulted in lower point density and/or data gaps, and
- b) had a limited feasibility to capture detailed floodplain topography given we limited ourselves to 1 to 1.5 days per site per technique
-
ALS DEMs were not as precise as TS or rtkGPS, but ALS surveys had superior coverage, overall point density, and derived DEMs resulted in a more comprehensive representation of floodplain topography
- TLS had a limited capacity to derive bare earth DEMs in areas with dense vegetation and does not provide a direct measure of bed topography
Conclusions
- For in channel surveys, TS and rtkGPS are the most reliable. However, rtkGPS surveys are limited at sites with dense vegetation or canyons, so of the two, TS are a more universal technique
- TLS is unreliable and inefficient in-channel, unless the channel in un-vegetated, water depth is extremely shallow, or the channel is dry
- ALS is unreliable in the wetted channel (but great on the floodplain), but may be a sufficient approximation of streambed elevation for some applications
Related Links & Research
- ELR/BPA: CHaMP Grand Ronde Crew Variability Study
- Integrated Status & Effectiveness Monitoring Program
- ISEMP - Lemhi River Intensively Monitored Watershed
- Columbia Habitat Monitoring Program
Project Outputs
Presentations from this Project
- \2011. Bangen SG, Wheaton J and Bouwes N. A Methodological Intercomparison of Topographic and Aerial Photographic Habitat Survey Techniques, American Fisheries Society 141st Annual Meeting: Seattle, WA, P-158.
- \2011. Wheaton JM and Bangen SG. Crew Variability in Topographic Data, Columbia Habitat Monitoring Program Post Pilot Season Workshop. NOAA: Portland, OR.
- \2011. Wheaton JM, Bangen SG and Portugal E. Topographic Survey Comparisons, Columbia Habitat Monitoring Program Post Pilot Season Workshop. NOAA: Portland, OR.
- \2011. Portugal E, Bangen SG and Wheaton J. The Relative Importance of Inserting TIN Topographic Breaklines in DEM Creation, AGU Fall Meeting 2011. American Geophysical Union: San Francisco, CA, pp. H51I-1312.
- \2010. Bangen SG, Wheaton JM and Bouwes N. Quantifying Stream Habitat: Relative Effort Versus Quality of Competing Remote Sensing & Ground-Based Survey Techniques AGU Fall MeetingSan Francisco, CA, pp. H43G-1338.
Publications from this Project
- In Review. Bangen SG, Wheaton JM, Bouwes N, Bouwes B, Jordan C. A methodological intercomparison of topographic survey techniques for characterizing instream habitat. Geomorphology.
- \2013. Bangen SG. Comparison of topographic surveying techniques. MS Thesis. Utah State University, 168 pp.
- \2011. Bangen SG, Wheaton JM and DeMeurichy KD. Methodological Intercomparison of Topographic & Aerial Photographic Habitat Survey Techniques, Ecogeomorphology and Topographic Analysis Lab, Utah State University, Prepared for Eco Logical Research and NOAA, Logan, Utah, 33 pp.
Datasets from this Project
- All topography and imagery collected… Forthcoming
- Watershed Sciences LiDaR from Lemhi Basin - Hosted on OpenTopogrpahy.org
Project Details
- Project PI: Joe Wheaton
- Project Personnel from ET-AL: Sara Bangen (MS Studentship) and Kenny DeMeurichy
- Project Collaborators: Nick Bouwes (ELR), Chris Jordan (NOAA), & Boyd Bouwes (Watershed Consultants)
- Funding Source: Bonneville Power Authority - Sub-award to USU from Eco Logical Research, Inc.
- Project Start Date: June, 2010
- Project End Date: November 2012


