gis
NOTE: if you haven’t already, you will need to activate the Spatial Analyst extension to complete this lab.
ArcMap > Customize drop down > Extensions. Click in the Spatial Analyst box to toggle on the check mark > Close.
In order to do anything your boss asked, you first have to define a catchment boundary. There are many ways you could do this. You could manually delineate the watershed based off of the contours (i.e. create a polygon shape file, and carefully draw the catchment). Numerous algorithms exist for deriving watersheds from digital elevation models. We’ll use one such algorithm that is built into the Spatial Analyst extension in ArcGIS. Delineating a watershed in ArcGIS requires using a sequence of hydrologic tools that create new output rasters at each step. Generally, the series of tools builds on itself by using the output raster from the previous tool as the input raster for the next tool in the series. The process is relatively user friendly, as the tool dialog boxes prompt you to use specific rasters for the input rasters.
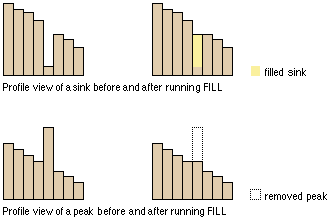
Step 1 - Fill the pits in the DEM
Most natural DEMs have depressions in them (also known as sinks or pits). Such sinks should be filled to ensure proper delineation of basins and streams. If the sinks are not filled, a derived drainage network may be discontinuous (read here for more information).
Navigate to the Spatial Analyst > Hydrology Tools > Fill in the Toolbox or search for the Fill tool. In the Fill dialog (below), specify the original input DEM and the name of the output raster you wish to create (make sure the name designates that it is a filled DEM).
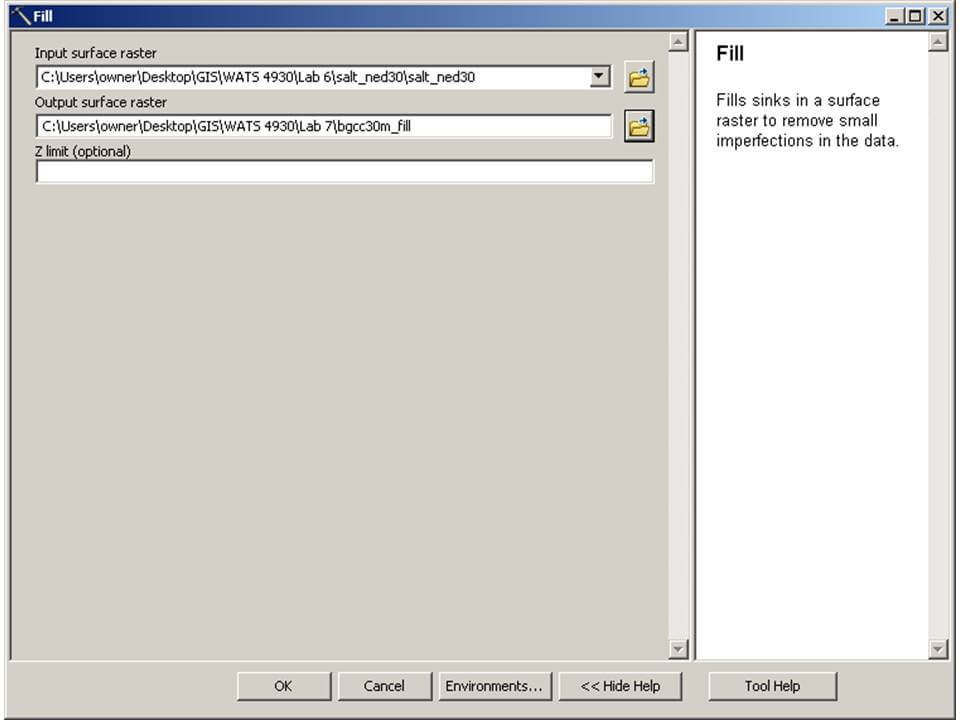
Make sure that all subsequent Hydrology Analyses in this lab are run on this filled DEM.
Step 2 - Calculate flow directions
The next step is to calculate flow directions. Again in the Toolbox, go to Spatial Analyst Tools -> Hydrology Tools -> Flow Direction.
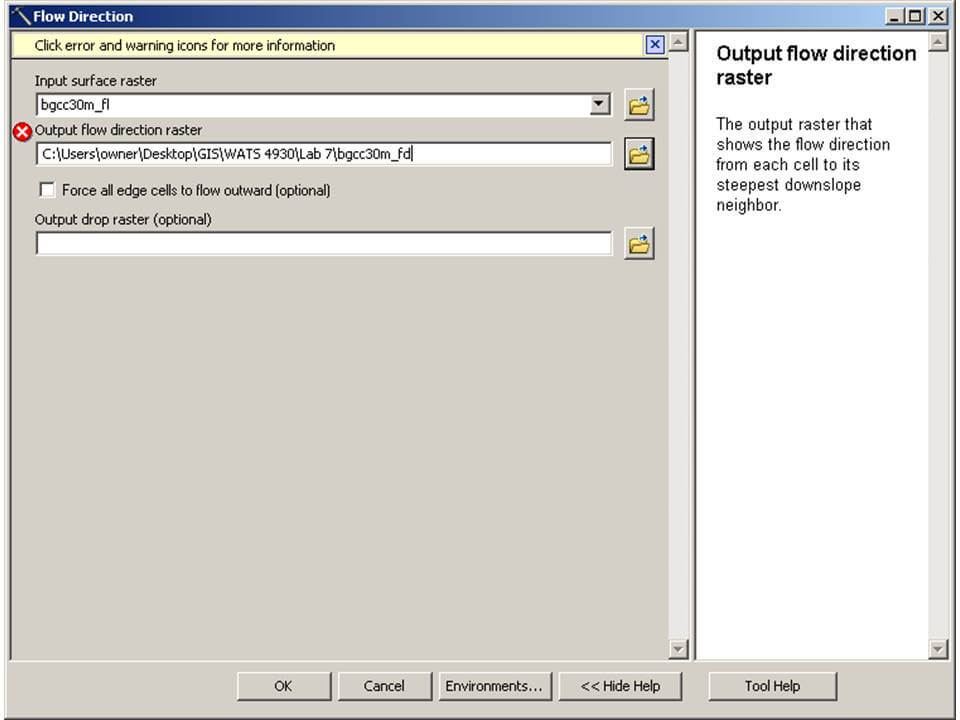
(Ignore the warning symbols in the screen shots. I was using file names that already existed because I had already done the analysis…)
Specify the pit-filled DEM (NOT the original DEM) as the Input raster, and specify the new output raster as a flow direction raster. You will use this flow-direction grid for other hydrology analyses.
WARNING! If you enter your regular DEM instead of the pit-filled DEM raster, this will not work correctly!
Step 3- Delineate the catchment and derive its area
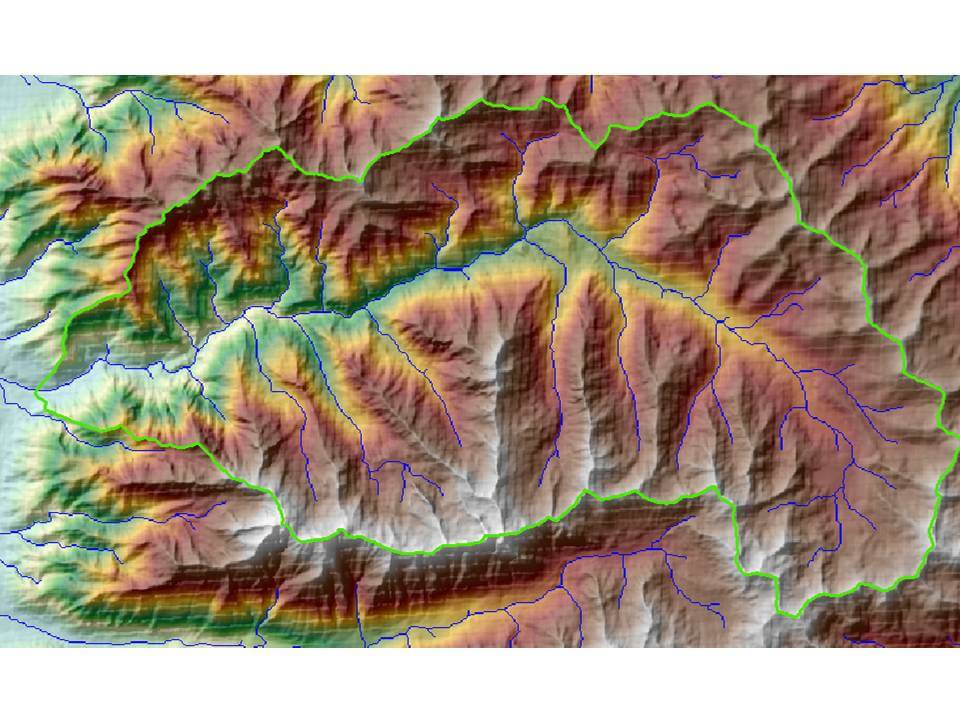
The Big Cottonwood Creek watershed is defined by the area that drains into Big Cottonwood Creek and exits at the mouth of Big Cottonwood Canyon. Any location on a landscape can be used to define the upslope area (i.e. watershed) that drains to it. A watershed is defined by this pour-point (its outlet). You need to choose an appropriate pour point to define the correct watershed for the Big Cottonwood Creek watershed. This doesn’t mean there is one specific grid cell that is the correct pour point for the canyon, but there are certainly a number of specifically incorrect ones. You have a shapefile from Lab 6 that defines the boundary of Big Cottonwood Creek watershed, but your boss would like you to delineate the boundary of this watershed to ensure the boundary is defined correctly.
You can “eyeball” the outlet from the DEM and hillshade and then use a tool called “Snap Pour Point” to force your ‘best guess’ pour point to snap to the lowest point or drainage channel as determined by the DEM. An alternative to guessing or using the Snap Pour Point tool is to determine where the lowest point of your intended watershed is. You can do this using the Flow Accumulation tool. You will use this for Task 2.
Flow Accumulation (Optional)
Search for the Flow Accumulation tool or in the toolbox: Spatial Analyst Tools > Hydrology > Flow Accumulation. The dialog box prompts you to input your flow direction raster. (See, it’s fool proof!) The output should be named something that designates the grid as a flow accumulation raster.
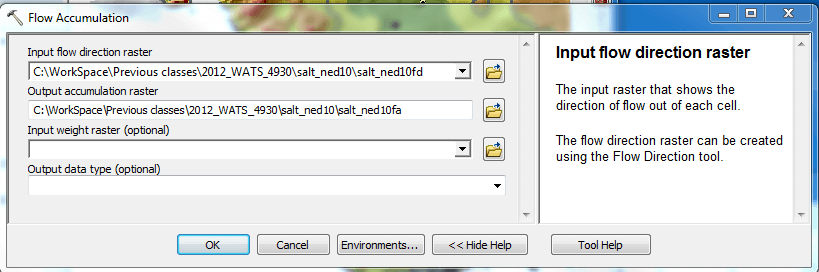
WARNING! If you enter your DEM instead of the flow direction raster derived above as your Input Flow Direction Raster, this will not work!
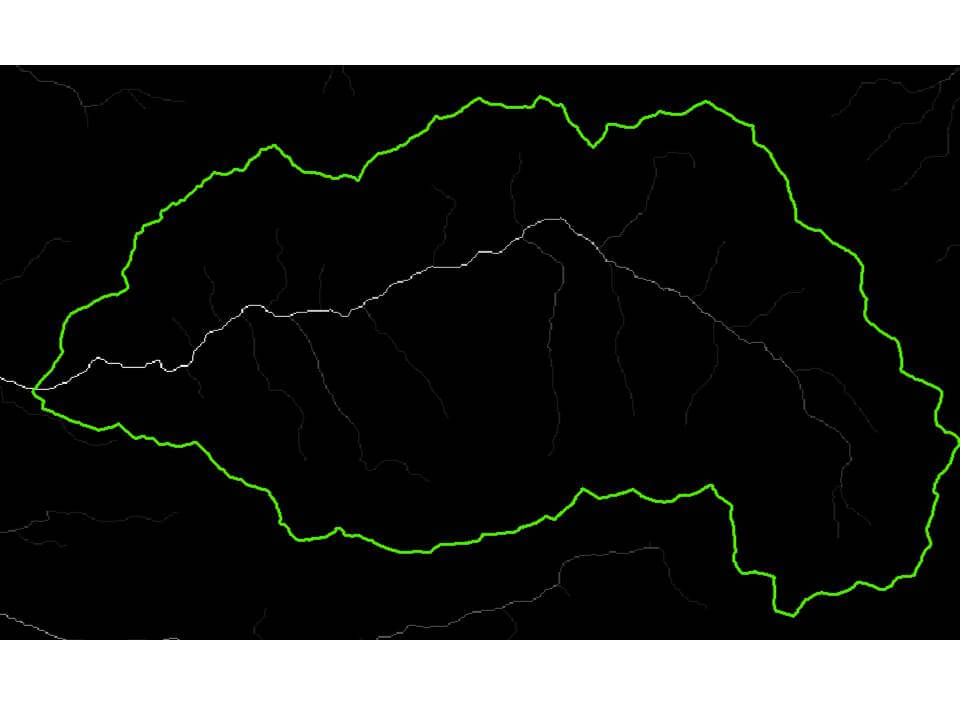
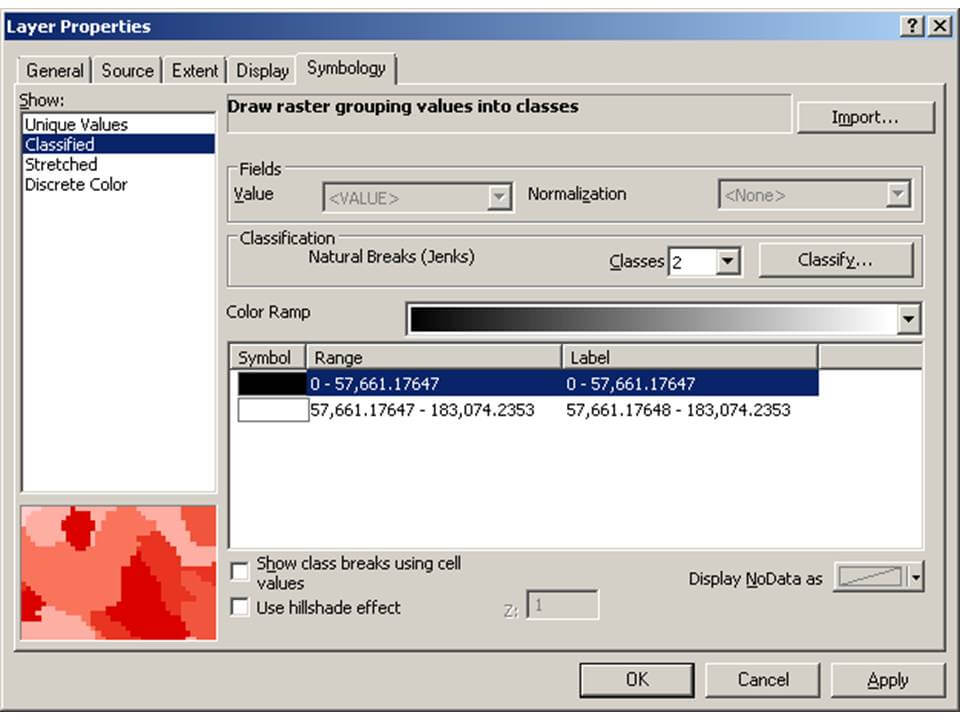
Your output may look something like the image on the left (the green ‘temporary’ watershed polygon is just there for reference). Change the symbology of the flow accumulation raster to show 2 classes. Make the smaller values class “no color” and the larger values something that will show well on your map (double click on the symbol box to change symbol properties) (see below).
Choose Pour Point
Now you are ready to determine your pour point. Considering the general topography of the canyon (or the flow accumulation information), determine an appropriate location for the pour point.
- You will create a new point shapefile as you’ve done in previous labs, and then start editing, add the single pour point, stop editing and save your changes. Note that you may need to edit this point to a new location if you find that your watershed doesn’t delineate correctly. Alternatively you can use the Snap Pour Point tool to do this adjustment.
Delineate Watershed
- Once you’ve defined your pour point in a shape file, You can delineate your watershed. Click on the Watershed tool in the Spatial Analyst Hydrology Tools Toolbox.
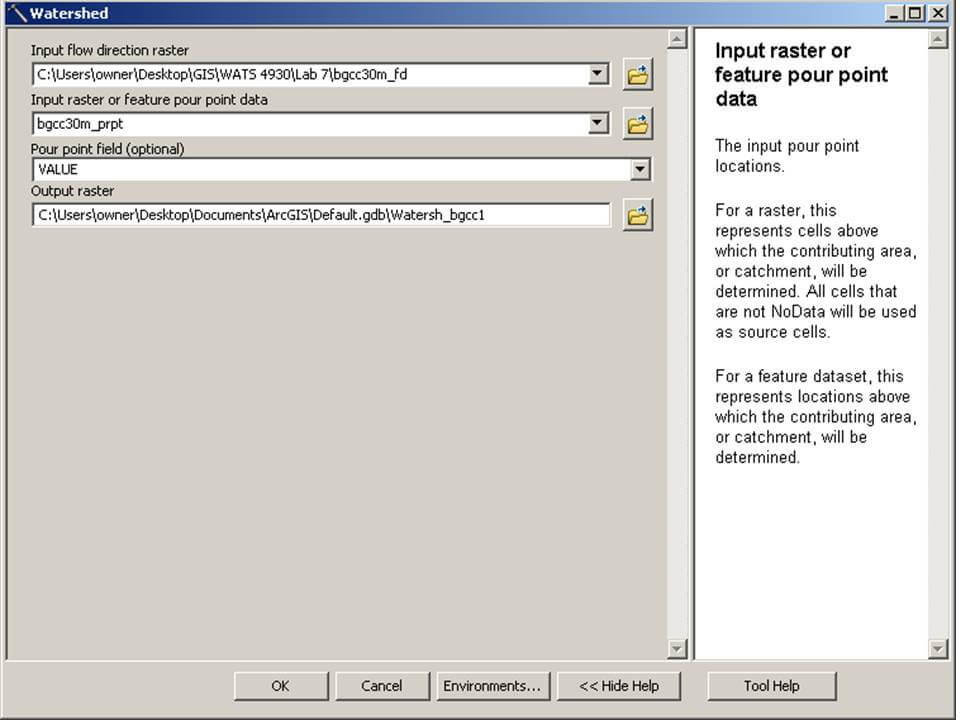
- In the dialog box, specify your flow direction grid as the input flow raster. Specify your shape file with the pour point as the feature pour point data. The default setting for pour point field will be ID, but can be any integer field (this value will be assigned to all cells located in the raster). Specify where you would like to save the output raster.
- The output from this will be a raster with cells assigned the value from whatever pour point field you specified (1 is default) representing the cells inside the catchment, and everywhere outside the catchment is ‘nodata’. Make sure you are happy with the delineation. It is easy for the delineation to be miscalculated and you may need to iterate on the exact location of the pour point (by editing and moving the point in the shape file), until you get a ‘correctly’ defined watershed.
Calculate Area (optional)
- If you are happy[1] with the delineation, you can now calculate the area (in km2) of this catchment as requested by your boss. There are numerous ways to do this. You could keep the catchment delineation as a raster and use the raster calculator to calculate the area (hint: you have everything you need to calculate area in the attribute table of the watershed and in the watershed raster layer’s properties dialog box), or you could convert this to a polygon feature (e.g. shape file or feature class) and use calculate geometry tool in a field called “Area_km2” (for example) to calculate the area within the shapefile’s attribute table, or you could use the Calculate Areas tool. When you get your value, make sure to verify its plausibility. One simple way to do this is to use the measurement tool to measure the length and width and estimate the area for the watershed.
What to Submit
For this task you should present your delineated watershed in a way that illustrates a difference between it and the watershed shapefile acquired from the UT AGRC. See What to Submit section on main Lab 8a page and Lab 8a rubric (Canvas) for details.
1] If you are not happy (i.e. watershed delineation is wrong), edit your pour point shape file and move the pour point, save it, and try the analysis again. Alternatively, in ArcGIS 10 a new feature called Snap Pour Point, can be used to do this automatically for you.